
Figures & data
Figure 1. Flowchart of TOA OLR estimation from MODIS data.
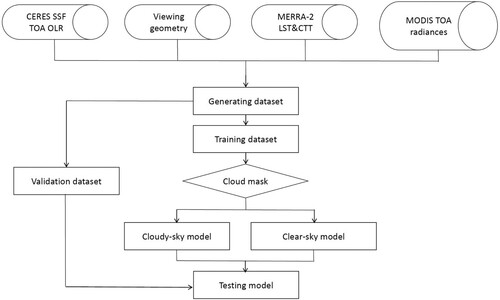
Figure 2. Test results of the TOA OLR derived from the clear-sky and cloudy-sky models using GBRT (unit: W/m2).
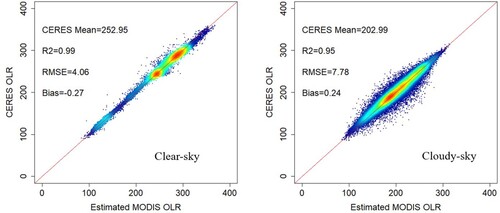
Figure 3. Relative importance of the 17 variables in the training process.
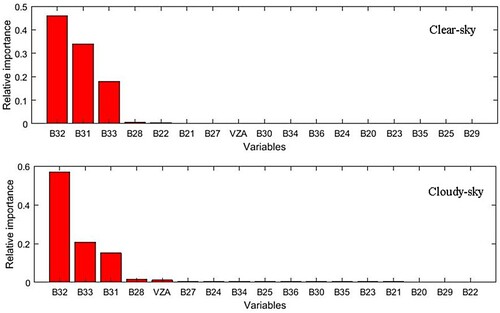
Figure 4. RMSE and Bias of the established models under the different VZA bins.
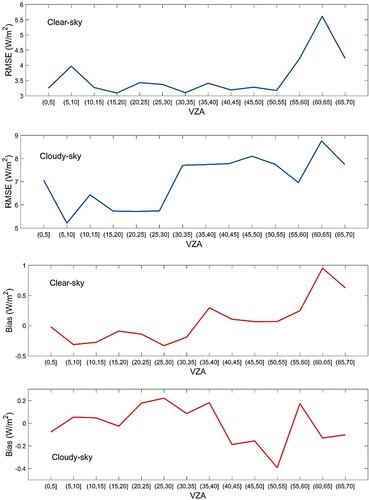
Figure 5. CERES SYN and the estimated MODIS daily OLR in East Asia on January 1st, 2001.
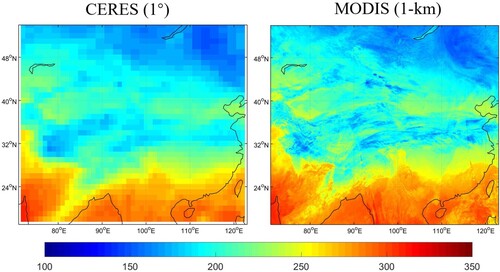
Figure 6. Spatial distribution and histogram of the differences between the estimated MODIS and CERES OLR in East Asia on January 1st, 2001.
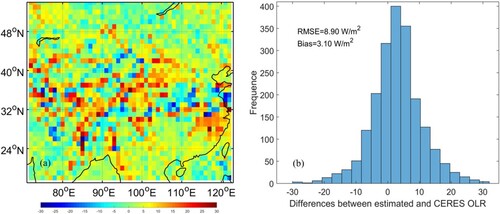
Figure 7. CERES monthly TOA OLR values and the differences from the estimated MODIS TOA OLR in January 2014 (a) CERES monthly TOA OLR (c) differences between estimated values and CERES, (b) and (d) are the same but for July 2014, (e) and (f) show corresponding total precipitable water vapor in MERRA-2.
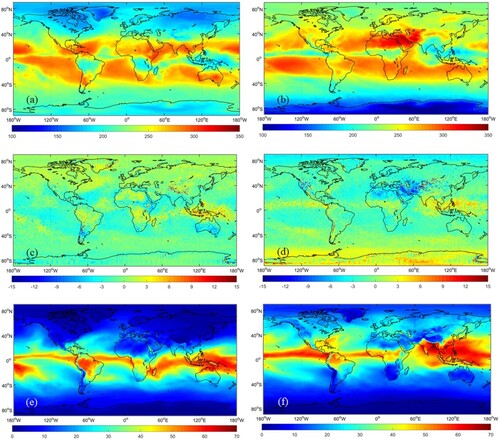
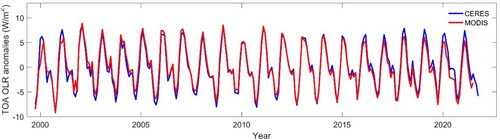
Figure 8. Time series (2000–2021) results of the CERES and MODIS global land monthly mean TOA OLR anomalies.
Data availability
The CERES datasets are downloaded at https://ceres-tool.larc.nasa.gov/ord-tool/jsp/SYN1degEd4Selection.jsp. The MODIS data are downloaded at https://modis.gsfc.nasa.gov/, and the MERRA-2 data can be downloaded at https://gmao.gsfc.nasa.gov/reanalysis/merra-2.