
Figures & data
Figure 1. Land cover map in Africa. The land cover map was aggregated from the International Geosphere Biosphere Programme (IGBP) land cover layer of MODIS land cover type products (MCD12Q1) for 2010. Forest consists of evergreen needleleaf forest, evergreen broadleaf forest, deciduous needleleaf forest, deciduous broadleaf forest, and mixed forest. Woodland is comprised of woody savanna. Shrubland is comprised of closed shrubland and open shrubland.
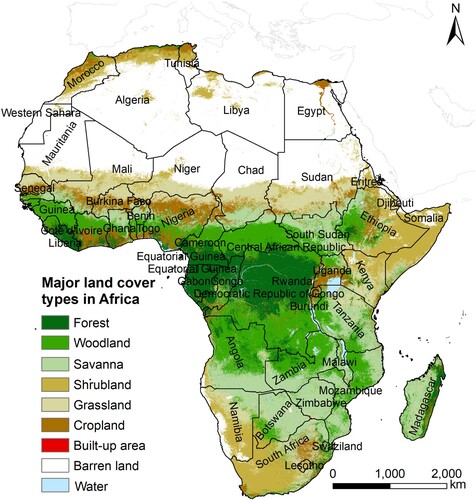
Figure 2. Spatial distribution of tree cover in 2020 for Africa.
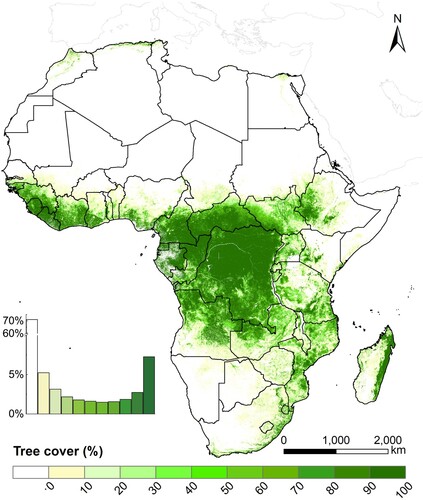
Figure 3. Linear trend map (%/year) of tree cover in Africa over 2000–2020. Grey color areas exhibited no significant trend at the 95% confidence level or the change/trend equal to 0%/year. White color areas exhibited non-forested (Pixels with tree cover approximately 0% of more than 18 years from 2000 to 2020).
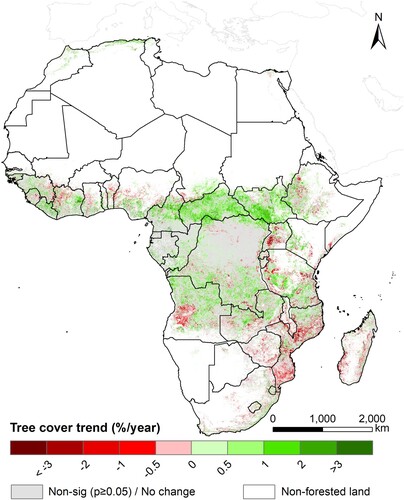
Figure 4. The area proportion of tree cover changing trend and the trend variations in different forest types in Africa. (a) Histogram of linear trend of tree cover over 2000–2020 in the whole continent, and (b) variations of trend in the initially closed forest (tree cover ≥ 70%), open forest (20% ≤ tree cover < 70%), and sparse forest (10% < tree cover < 20%). Black bars mean the median value of the trend and green bars represent the quartiles of the trend. Note that the plot does not include insignificant trends (p ≥ 0.05). Different forest types were referenced from the GLOBMAP fractional tree cover data in 2000 based on the definition of the Land Cover Classification System (LCCS).
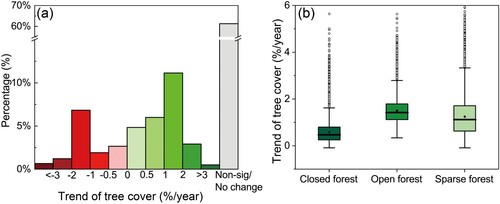
Figure 5. Annual forest area dynamics, gain and loss in Africa and typical forest biomes during 2000–2020. Interannual changes in (a) Africa, (b) rainforest, (c) woodland, and (d) savanna.
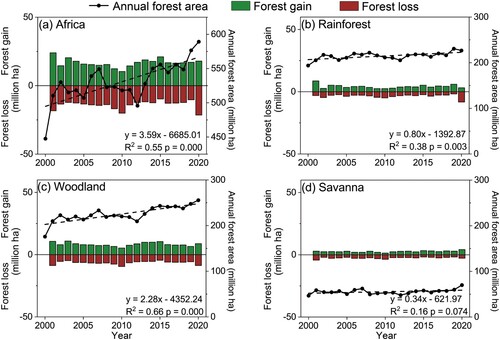
Figure 6. Hotspots of forest area loss and gain from 2000 to 2020 in Africa at the country scale. Top ten countries with the most (a) forest area loss and (b) forest area gain over 2000–2020.
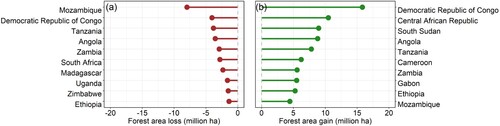
Figure 7. Forest change maps based on GlobeLand30, AVHRR VCF, MODIS VCF and GFC products, and annual mean LAI change map. (a) Forest change of GlobeLand30 from 2000 to 2020, (b) linear trend of percent tree cover of AVHRR VCF from 2001 to 2016, (c) linear trend of percent tree cover of MODIS VCF from 2000 to 2020. Grey color areas exhibited no significant trend at the 95% confidence level or the change ratio equal to zero. White color areas exhibited no forest or tree covered. (d) Forest cover gain from 2000 to 2012 and (e) forest cover loss from 2000 to 2020 of GFC in Africa. (f) Linear trend of annual mean LAI from 2000 to 2020, white color represented no forest-covered areas of GLOBMAP fractional tree cover product (pixels with tree cover approximately 0% of more than 18 years from 2000 to 2020).
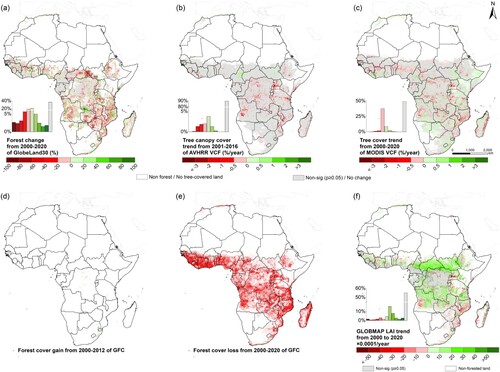
Figure 8. High spatial resolution images from Google Earth in three sites as examples. (a) Site 1 in South Sudan (26.01°E, 7.22°N), (b) site 2 in Zambia (31.18°E, 13.49°S), and (c) site 3 in the Central African Republic (19.02°E, 5.29°N).
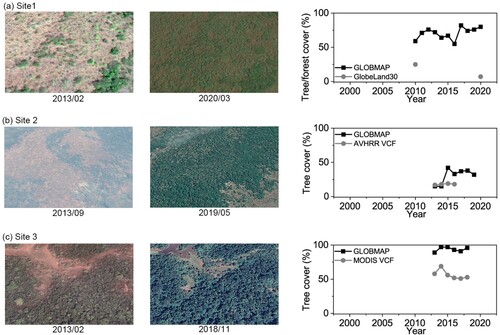
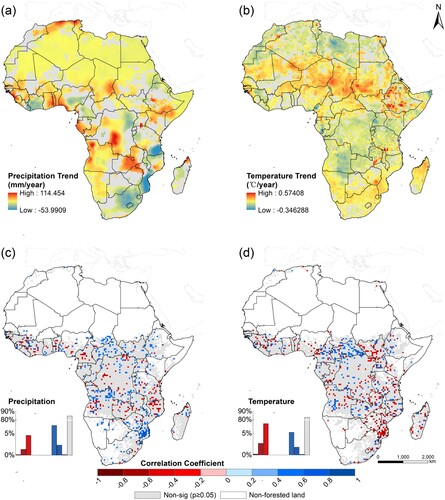
Figure 9. Linear trend and correlation coefficient maps for precipitation and temperature in Africa over 2000–2020. The spatio-temporal trend of (a) annual accumulated precipitation and (b) annual mean temperature. Pearson’s correlation coefficient between tree cover and (c) annual accumulated precipitation and (d) annual mean temperature. Grey color areas exhibited no significant trend or correlation at the 95% confidence level. White color areas exhibited no forest-covered (Pixels with tree cover approximately 0% of more than 18 years from 2000 to 2020).
Data availability
The GLOBMAP fractional tree cover product that support the findings of this study are available from the corresponding author upon request.