
Figures & data
Figure 1. Workflow chart of the proposed methodology.
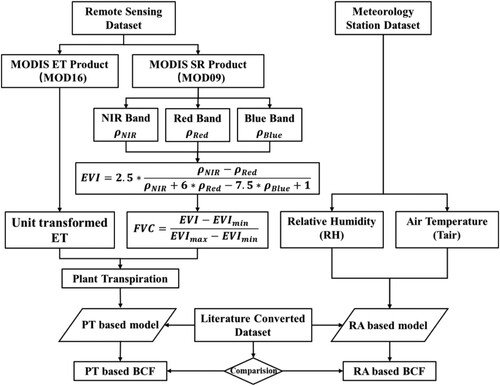
Figure 2. The annual Atrazine BCF among the U.S.A. different states.
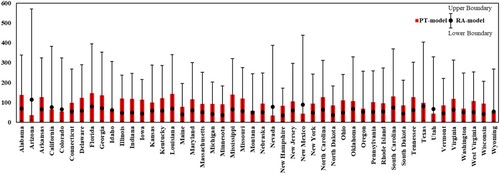
Figure 3. (a) The PT-model simulated U.S.A. annual Atrazine BCF map (b) The relationship between the RA-model and the PT-model derived BCF values.
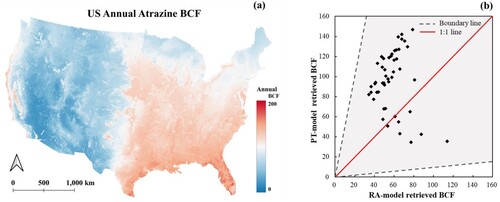
Figure 4. (a) SD map of the RA-model (b) SD map of the PT-model (c) CV map of the RA-model (d) CV map of the PT-model.
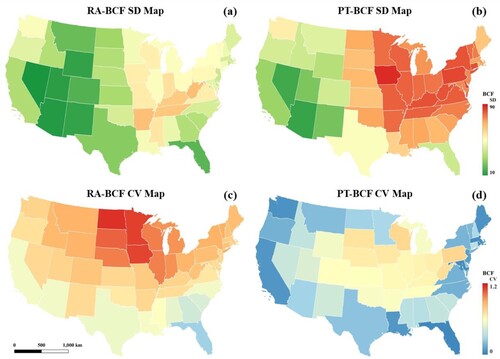
Table 1. Atrazine usage for Illinois, Indiana, Iowa, and Kansas (from the USGS Annual Agricultural Pesticide Use dataset).
Figure 5. (a) RA-model estimated U.S.A. state average annual Atrazine BCF map (b) PT-model estimated U.S.A. state average annual Atrazine BCF map.
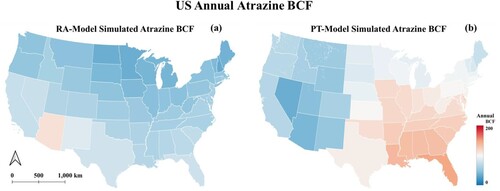
Figure 6. (a) U.S.A. spring Atrazine BCF map (b) U.S.A. state average spring Atrazine BCF map (c) U.S.A. summer atrazine BCF map (d) U.S.A. state average summer Atrazine BCF map (e) U.S.A. autumn Atrazine BCF map (f) U.S.A. state average autumn Atrazine BCF map (g) U.S.A. winter Atrazine BCF map (h) U.S.A. state average winter Atrazine BCF map.
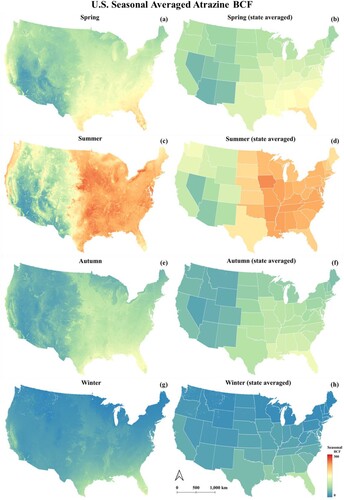
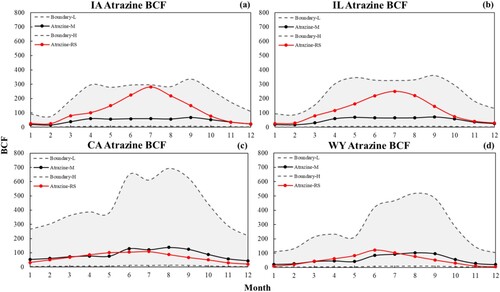
Figure 7. (a) Iowa annual time series of Atrazine BCF (b) Illinois annual time series of Atrazine BCF (c) California annual time series of Atrazine BCF (d) Wyoming annual time series of Atrazine BCF.
Data availability
The data that support the findings of this study are openly available in NASA MODIS Portal (https://modis.gsfc.nasa.gov/), USGS Annual Agricultural Pesticide Use dataset (https://water.usgs.gov/nawqa/pnsp/usage/maps/compound_listing.php), Fantke et al. (Citation2017) and Lewis et al. (Citation2006).