Figures & data
Figure 1. Global land cover maps and major characteristics from 1980s to 2020s. AVHRR: Advanced Very High Resolution Radiometer; NOAA: National Oceanic and Atmospheric Administration; UMD: University of Maryland; SPOT: Satellite Pour l'Observation de la Terre; MODIS: Moderate Resolution Imaging Spectroradiometer; MERIS: Medium Resolution Imaging Spectrometer; VCF: Vegetation Continuous Fields; PROBA-V: Project for On-Board Autonomy – Vegetation; TM: Thematic Mapper; ETM+: Enhanced Thematic Mapper Plus; OLI-TIRS: Operational Land Imager/Thermal Infrared Sensor; MSI: MultiSpectral Instrument; ESA: European Space Agency; CCI: Climate Change Initiative; GLAD: Global Land Analysis & Discovery Laboratory; ESRI: Environmental Systems Research Institute, Inc.
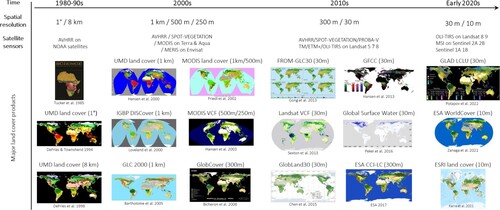
Figure 2. 10 m Analysis Ready Data (ARD) based on Sentinel-2 satellites shows spatial and temporal coherency for large-area land cover mapping. A. Surface reflectance mosaic over the Conterminous United States in August 2021. B and C. Zoom-in examples showing the spatial details of ARD at the crop field level. White squares on A and B indicate the spatial extents of B and C, respectively. D-I. Time series of ARD depicting the temporal variations of vegetation phenology throughout the year. Straight white lines overlaid on the panels represent the boundaries of ARD tiles.
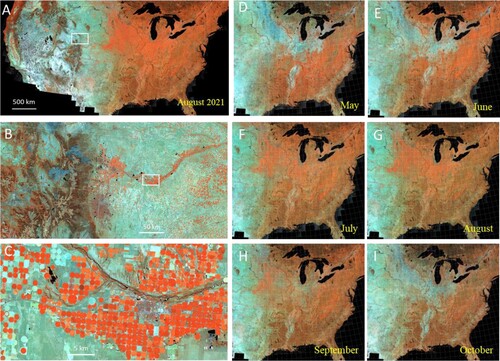
Figure 3. A conceptual workflow for long-term land cover monitoring over broad spatial extent. The workflow consists of three major steps in a spatially, temporally and statistically explicit manner. ARD: Analysis Ready Data.
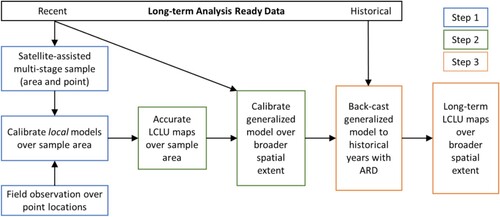
Figure 4. Vegetation loss generated by the global land surface disturbance project can be used to assess the impacts of a variety of natural disasters. For each panel, the first and second columns are Harmonized Landsat Sentinel-2 (HLS) images before and after a natural disaster shown in shortwave-infrared – near-infrared – red band combination. The last columns are vegetation loss layers with >50% vegetation cover reduction shown in white. A. Flooding in Henan, China, 17–31 July 2021. B. Bootleg Fire in Oregon, USA, July 6–Aug 16, 2021. C. Derecho in Iowa, USA, 10–11 August 2020.
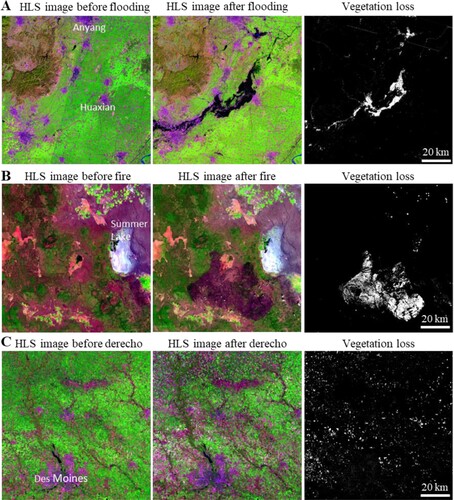
Figure 5. A satellite-based 10 m maize and soybean map over China using data from Li et al. (Citation2023) A. Overview of the map over China. B. Large maize and soybean fields in the Northeast China Plain. C. Small-holder maize and soybean in the North China Plain. D and E. Dryland maize cultivation in Northwest China.
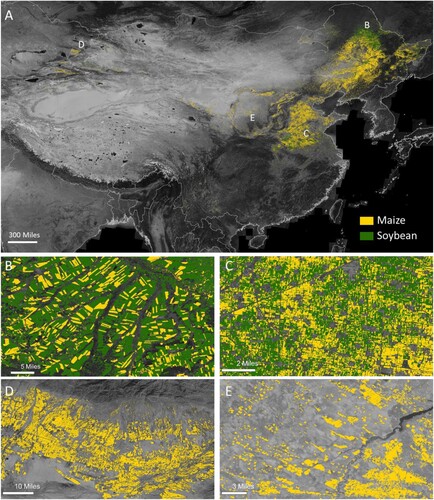
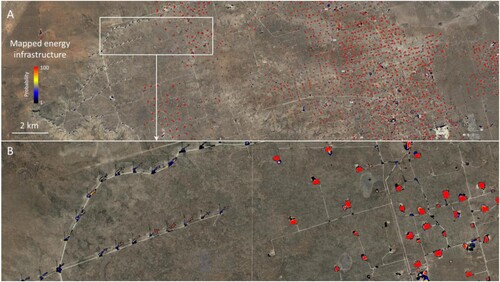
Figure 6. Energy infrastructure (wind turbines and oil/gas pads) mapped using National Agriculture Imagery Program (NAIP) data and deep learning algorithms over West Texas. Red polygons on the right represent mapped oil/gas pads.