
Figures & data
Figure 1. Distribution of lakes and lakes with in-situ salinity measurements across the Tibetan Plateau.
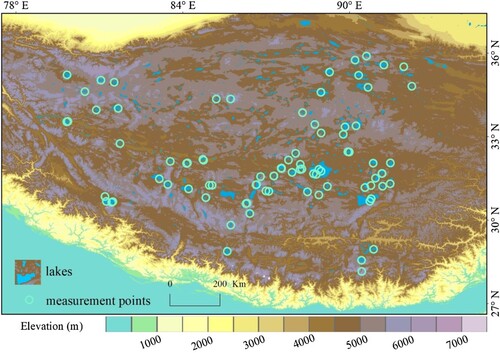
Figure 2. Remote sensing data processing, modeling, salinity extraction, and analysis flowchart.
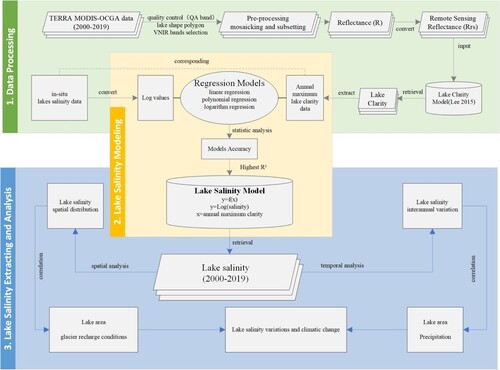
Figure 3. Relationship between the measured salinity of the lake and the maximum clarity (SD value) in the corresponding year.
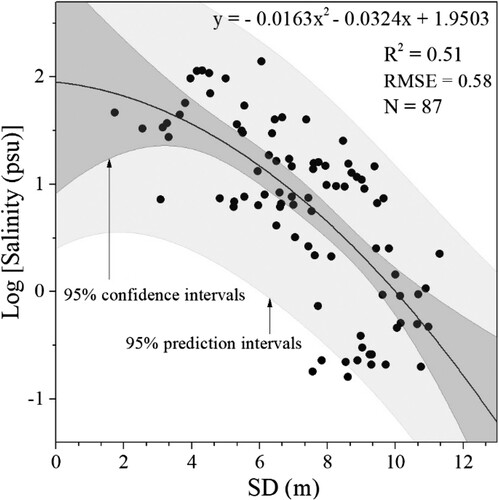
Figure 4. Changes in retrieval values of salinity of 152 lakes of greater than 50 km2 on the Tibetan Plateau from 2000 to 2019.
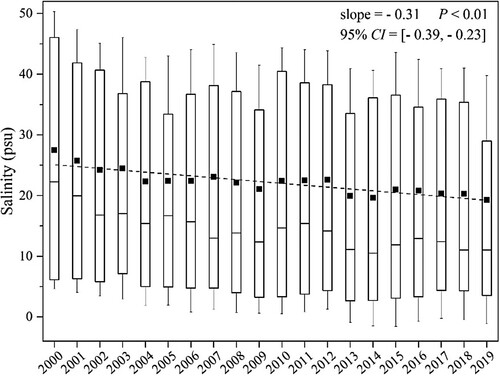
Figure 5. Absorbance characteristics of different concentrations of inorganic salt solutions based on laboratory standard control measurement.
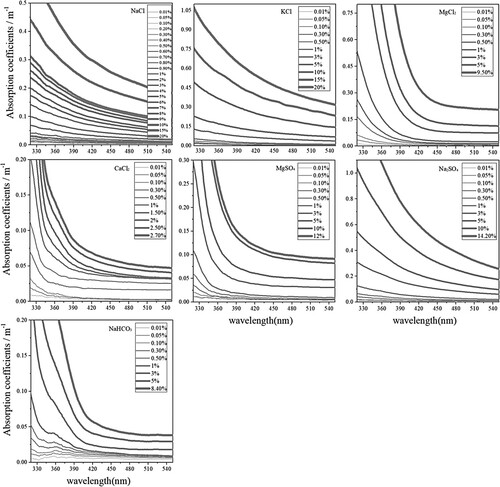
Figure 6. Relationship between absorption coefficients (average in 400–550 nm) and concentration of different inorganic salt solutions.
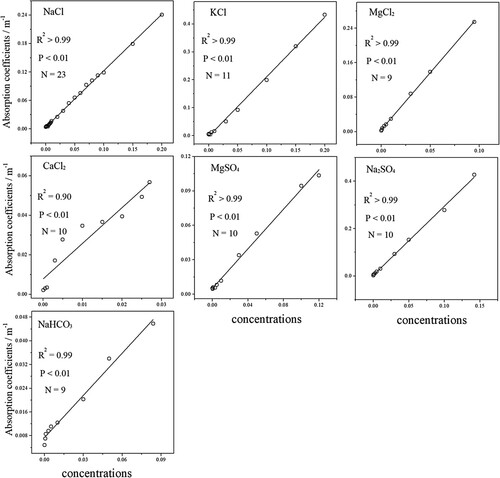
Figure 7. Spatial distribution of interannual changes (psu value and percent value) in retrieved salinity from 2000 to 2019 in 152 lakes with an area greater than 50 km2 on the Tibetan Plateau.
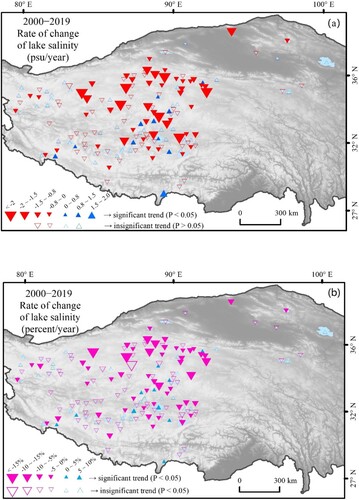
Figure 8. Relationship between retrieved salinity and lake area (converted to a log value for improved visualization).
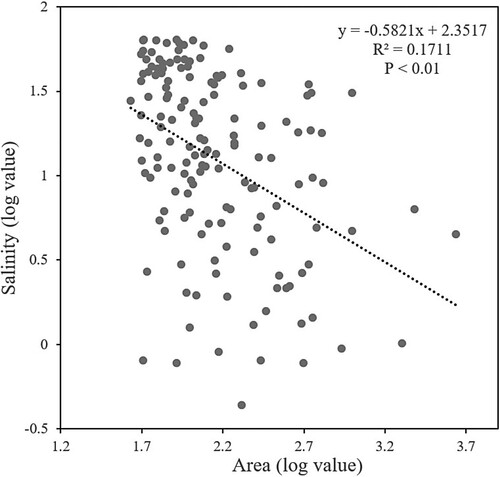
Figure 9. Relationship between interannual change in retrieved salinity data (divided into significant/insignificant changes in lakes) and interannual change in lake area on the Tibetan Plateau.
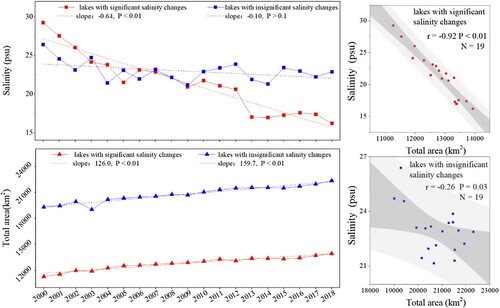
Figure 10. Comparison of changes in salinity and salinity of lakes between glacier recharge and non-recharge regions.
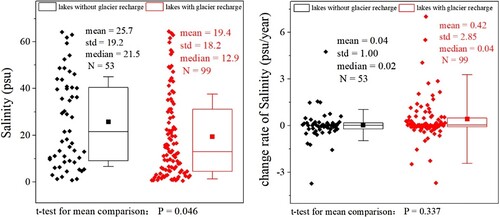
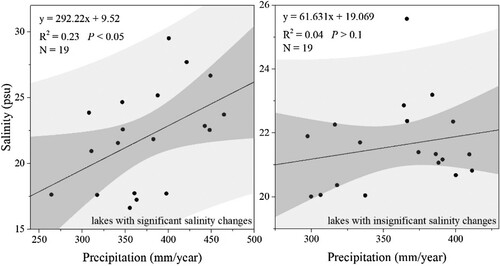
Figure 11. Relationship between interannual changes in salinity and precipitation of 152 studied lakes with an area greater than 50 km2 on the Tibetan Plateau in 2000–2019.
Data availability statement
The data that support the findings of this study are available from the corresponding author upon reasonable request.