Figures & data
Table 1. IUCN threats classification scheme (Version 3.3).
Table 2. The IUCN Red List and two types of weights.
Table 3. The assessed species and endemic species.
Table 4. The assessment results of species assessed in both 2013 and 2020.
Table 5. The transformation matrix of the IUCN Red List categories of species assessed in both 2013 and 2020.
Table 6. The IUCN criteria used of the higher plants assessed in both 2013 and 2020.
Figure 1. Altitudinal distributions of threatened species.
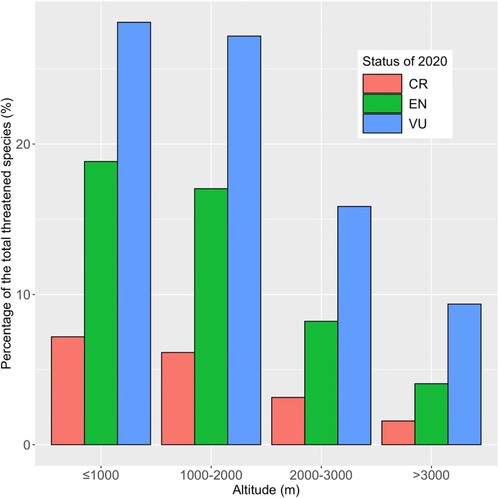
Figure 2. The percentage of threatened species in each province. The two columns indicate, respectively, the percentage of the species recorded for that province which are assessed as threatened (left) and the proportion of all China’s threatened species which are recorded for that province (right).
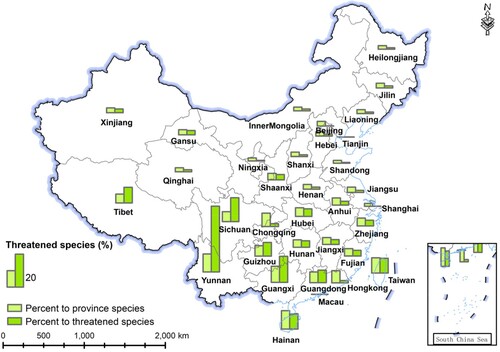
Figure 3. Red List Index (RLI) of 2013 and 2020 for higher plants with equal steps method and extinction risk method.
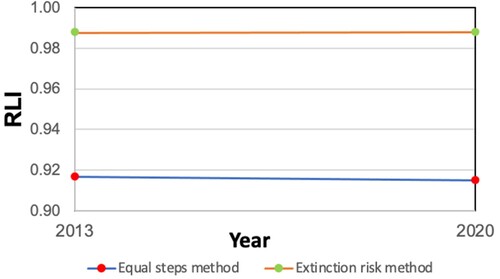
Figure 4. The status of species assessed both globally and in China.
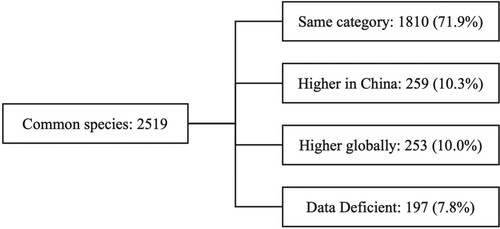
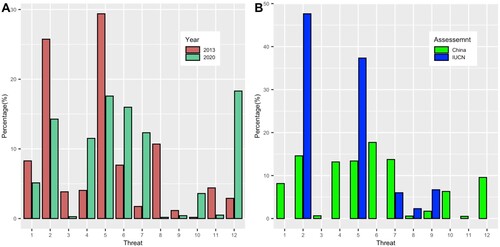
Figure 5. The percentage of threats of species for China and IUCN. A. the percentage of threats of Chinese assessments in 2013 and 2020; B. the percentage of threats of Chinese assessments in 2020 and IUCN. The threats are: 1. Residential & commercial development, 2. Agriculture & aquaculture, 3. Energy production & mining, 4. Transportation & service corridors, 5. Biological resource use, 6. Human intrusions & disturbance, 7. Natural system modifications, 8. Invasive & other problematic species, genes & diseases, 9. Pollution, 10. Geological events, 11. Climate change & severe weather, 12. Other options.