
Figures & data
Figure 1. Overview of the framework.
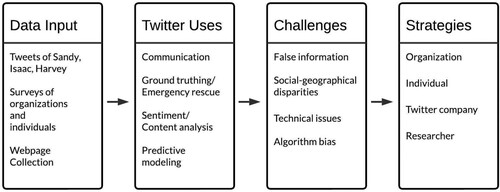
Figure 2. Map of Harvey rescue request tweets in Houston, USA, showing widespread rescue requests in the impacted region.
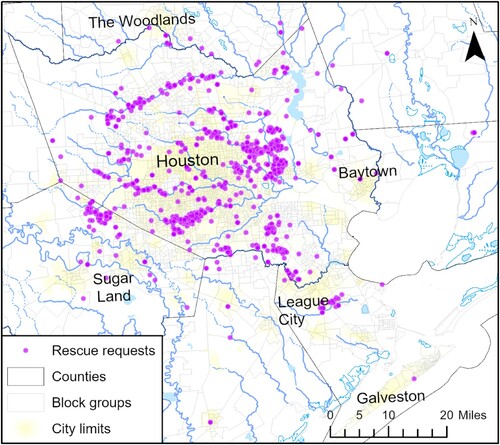
Figure 3. County-level ratio indices during Hurricanes Sandy 2012 (left) and Harvey 2017 (right) showing high tweet ratios near the event (After Zou et al. Citation2019b).
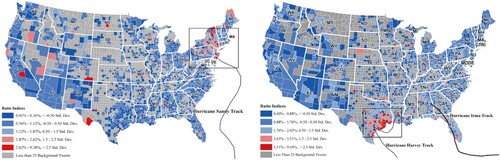
Figure 4. Mean sentiment scores during Hurricanes Isaac, Sandy, and Harvey (After Wang K et al. 2021).
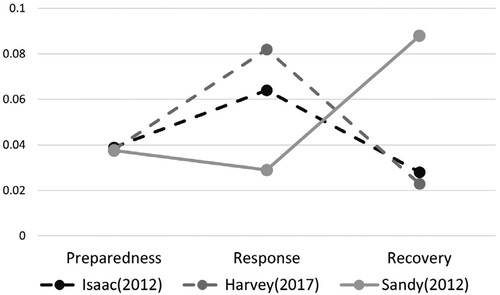
Table 1. Proposed strategies to improve Twitter use for disaster resilience (see text for detailed description).
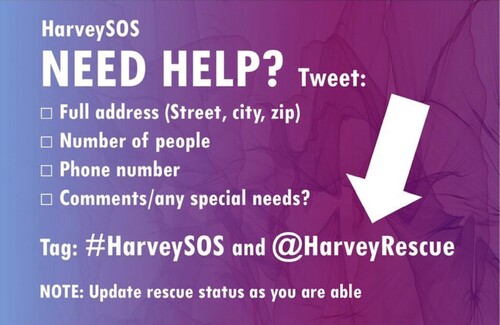
Figure 5. An example of Twitter emergency rescue request template (Zou et al. Citation2023).
Data availability statement
The authors confirm that the data supporting the findings of this study are available within the article.