Figures & data
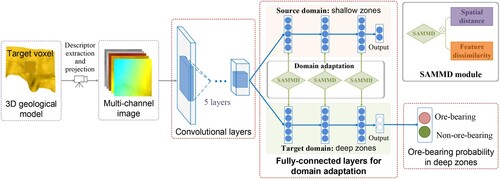
Figure 1. Pipeline and architecture of spatial-associated domain adaptation network for 3D MPM. Given the 3D geological model and a target voxel, we generate a multi-channel image for the voxel via descriptor extraction and projection and input it to the deep neural network. The backbone of the network is a convolution neural network consisting of five convolutional layers and three fully-connected layers. The mineralization-associated features are extracted from fully-connected layers for domain adaptation. To extract the transferable features across geospace, we achieve domain adaptation by using the SAMMD module, which measures the spatial-associated domain discrepancy between shallow and deep zones according to spatial distance and feature dissimilarity. The transferable features learned by minimizing the SAMMD are finally used to predict the ore-bearing probability for the target voxel.
Algorithm 1 Framework of domain alg:Framwork adaptation with SAMMD.
Figure 2. Geological map of the Sanshandao gold deposit (adapted from Song et al. Citation2021).
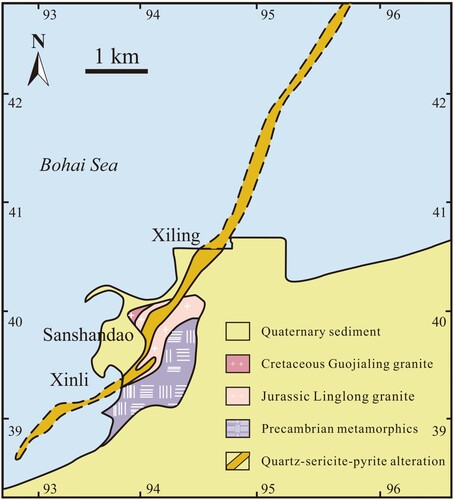
Figure 3. Mineralization-alteration zoning pattern (at section line # 96) of the Sanshandao gold deposit (adapted from Hu et al. Citation2013).
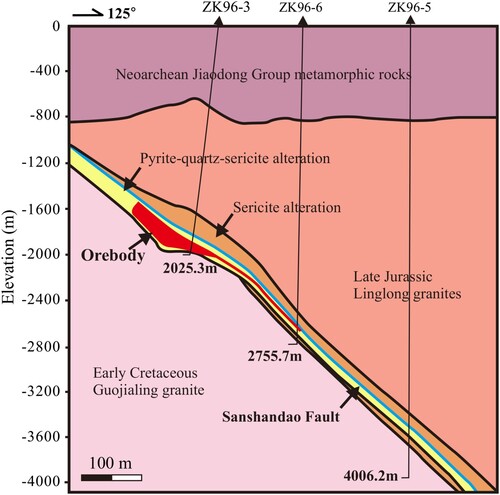
Figure 4. 3D models of Sanshandao faults (a), orebodies (Au grade ≥ 1g/t) (b), and drillholes (c). Left column: down-plunge views, right column: top views.
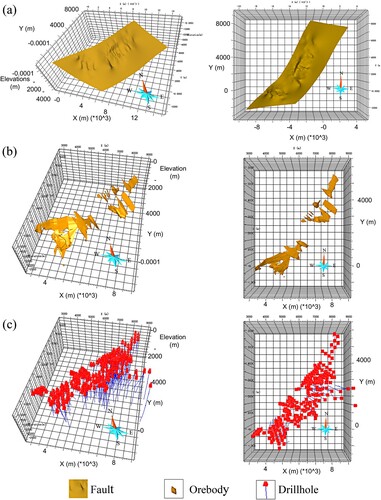
Table 1. Summary of data characteristics.
Figure 5. Shape descriptors of Laplace–Beltrami eigenfunctions (a) and surface normals (b) of the Sanshandao fault.
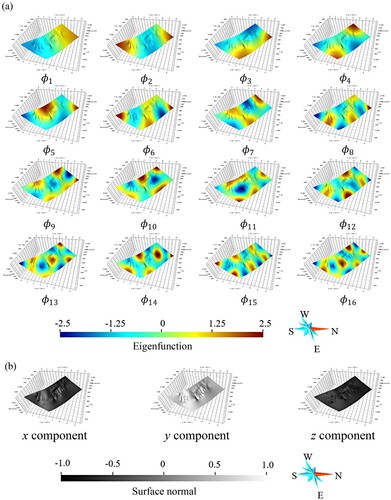
Figure 6. Projection results of the shape descriptors for target voxels: Laplace–Beltrami eigenfunctions (a) and surface normals (b).
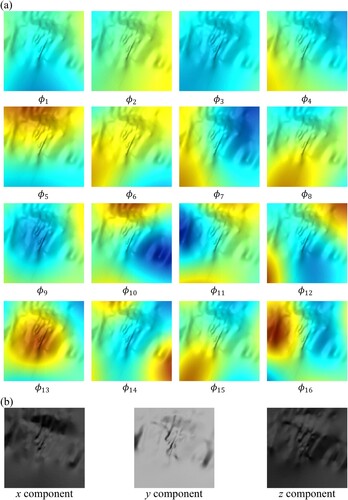
Figure 7. ROC curves (a) and success-rate curves (b) for the five evaluated prospectivity models. The SAMMD-based model attains the best performance among the five tested methods.
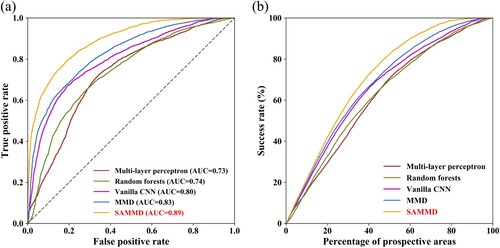
Figure 8. Cross entropy and SAMMD loss resulting from CNN, MMD and SAMMD models.
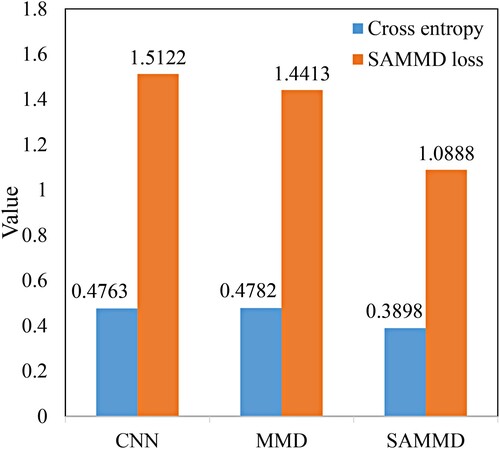
Figure 9. Variograms corresponding to the SAMMDs for 3D MPM at Sanshandao.
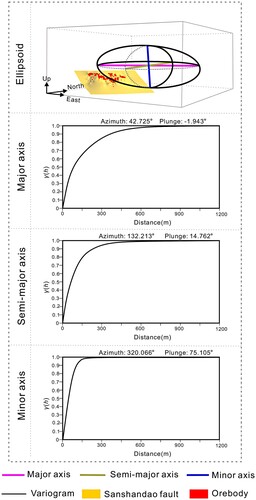
Table 2. MYIs and the corresponding thresholds for the SAMMD and the MMD-based models.
Figure 10. The high-potential areas resulting from the SAMMD (a) and the MMD (b) models.
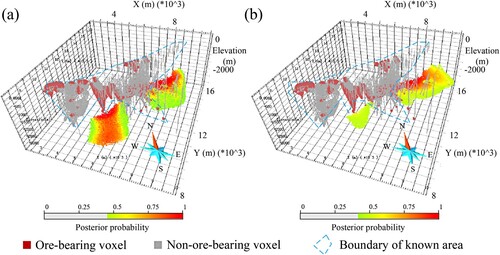
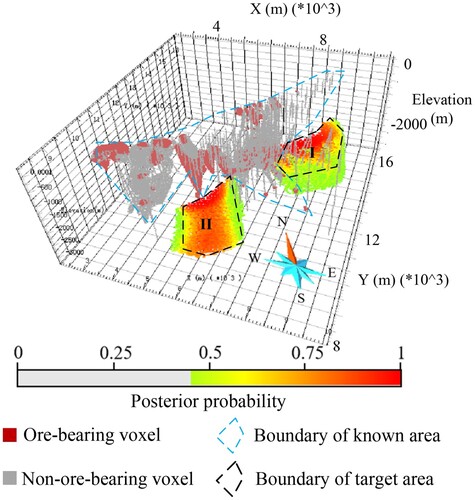
Figure 11. Two mineral exploration targets identified by the SAMMD model.