Figures & data
Figure 1. Flowchart of the proposed method.
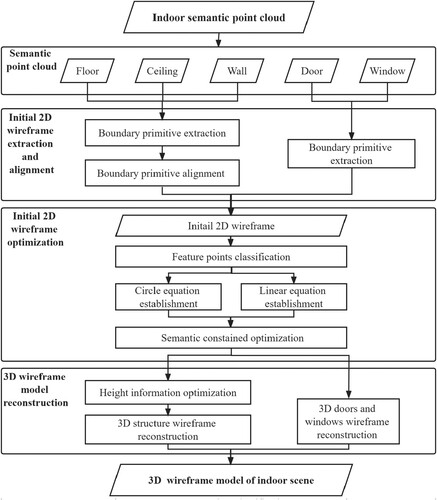
Figure 2. Floor boundary primitive extraction. (a) Rough boundary of . (b) Detailed boundary of
. (c) Illustration of combined polygons. (d) Result of boundary extraction.
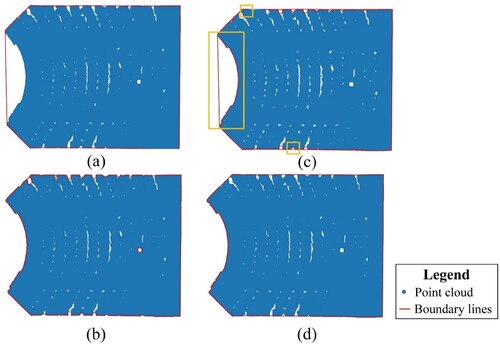
Figure 3. Wall primitives extraction with the M-RSC method.
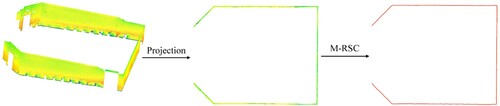
Figure 4. Illustration of the boundary primitives alignment.
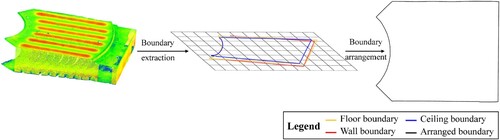
Figure 5. Classification of feature points.
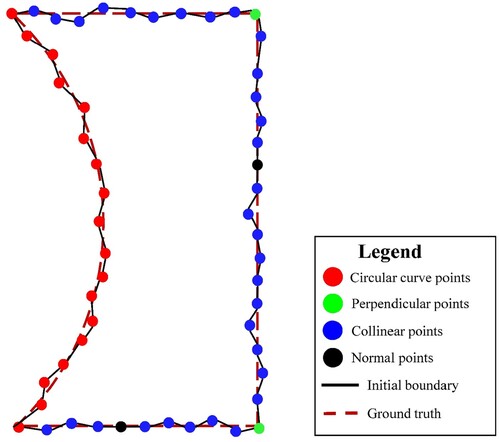
Figure 6. Illustration of linear feature optimization. (a) Perpendicular condition. (b) Collinear condition.
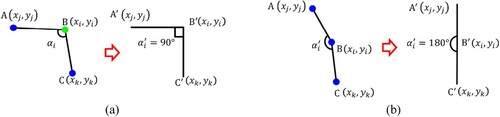
Figure 7. Pipeline of the iterative semantic constrained optimization method.
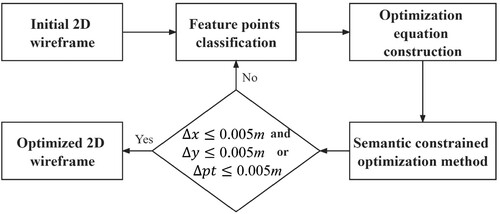
Figure 8. Comparison between the initial 2D wireframe and optimized 2D wireframe.
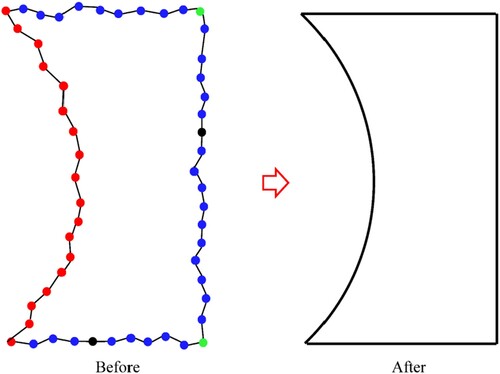
Figure 9. Pipeline of door and window wireframe extraction.
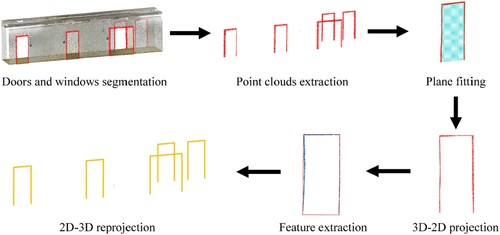
Figure 10. Illustration of height information extraction. (a) Schematic diagram of the cylinder method. (b) Example of height extraction by the cylinder method.
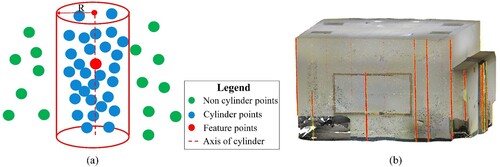
Figure 11. Height information optimization. (a) Abnormal height. (b) Height undulation. (c) Corrected abnormal height. (d) Smooth height edges.
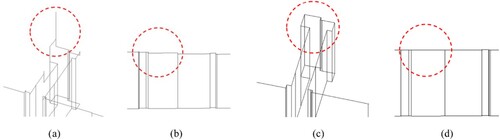
Figure 12. Reference height extraction by a height histogram. (a) Histogram of the height distribution of points. (b) Corresponding plane detected by the histogram.
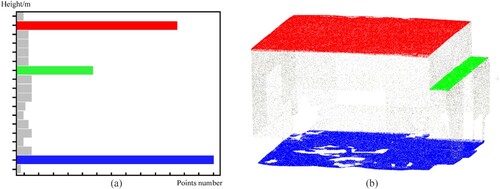
Figure 13. Height information extraction and reconstruction. (a) Height information in the point cloud. (b) Reconstruction structure from height information.
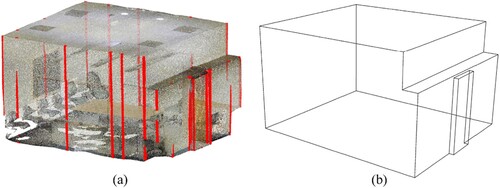
Figure 14. Three experimental scenes.
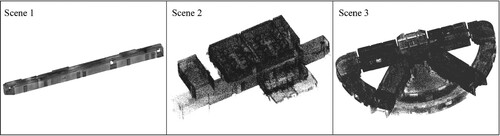
Table 1. Data description of testing scenes.
Table 2. Parameters for floor boundary extraction.
Table 3. Parameters for wall boundary extraction.
Figure 15. Three indicators of accuracy evaluation.
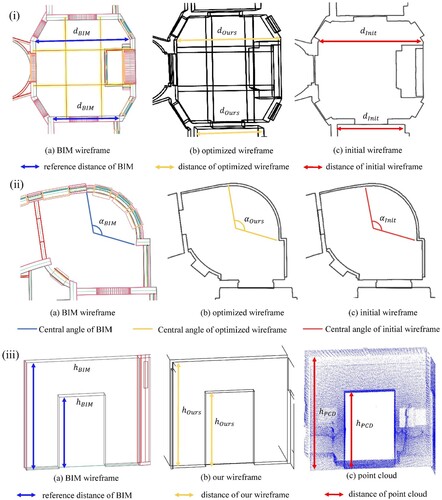
Figure 16. Initial 2D wireframe of experimental scenes. (a) Scene 1. (b) Scene 2. (c) Scene 3.
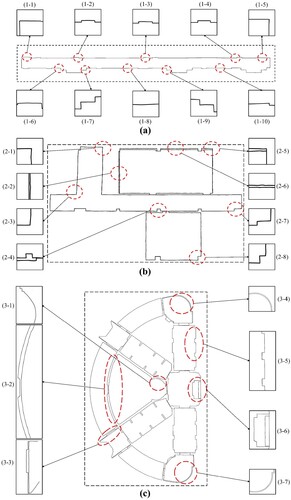
Figure 17. Optimized 2D wireframe of experimental scenes. (a) Scene 1. (b) Scene 2. (c) Scene 3.
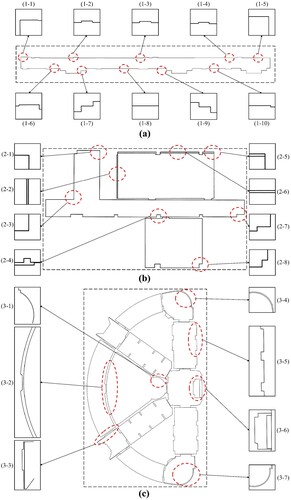
Figure 18. 3D wireframes of Scene 1. (a) 3D wireframe with semantics. (b) Details of doors and windows.
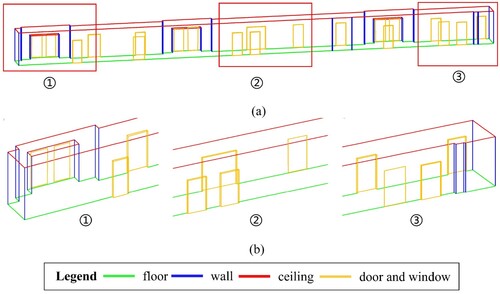
Figure 19. 3D wireframe of Scene 2.
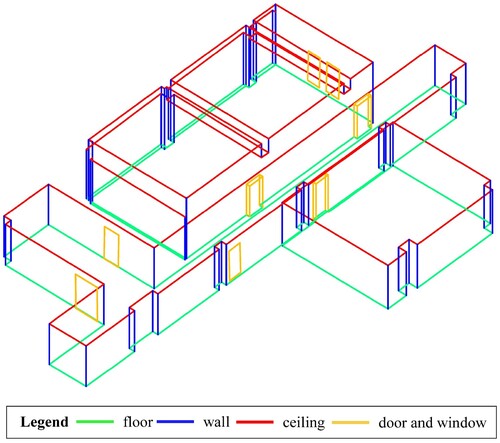
Figure 20. 3D wireframe of Scene 3.
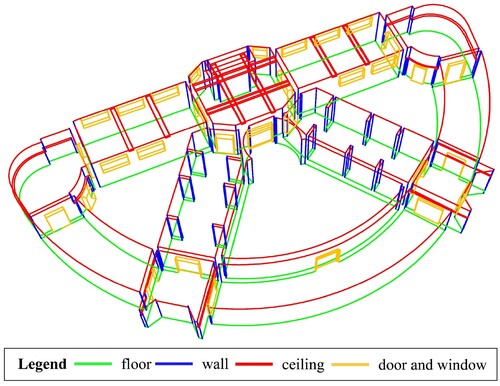
Figure 21. Distribution of the accuracy evaluation. (a) Planar accuracy. (b) Curve accuracy. (c) Height accuracy.
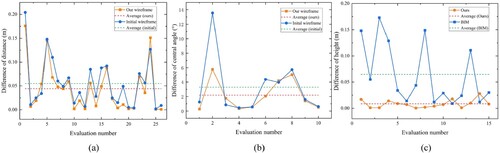
Table 4. Average of evaluation indicators.
Figure 22. 2D Method comparison on Scene 3. (a) BIM. (b) our method. (c) Wu et al.’s method.
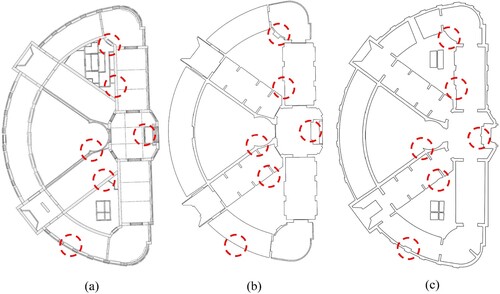
Figure 23. 3D Method comparison on Scene 2. (a) Our method. (b) Oesau et al.’s method. (c) Wang et al.’s method. (d) Han et al.’s method.
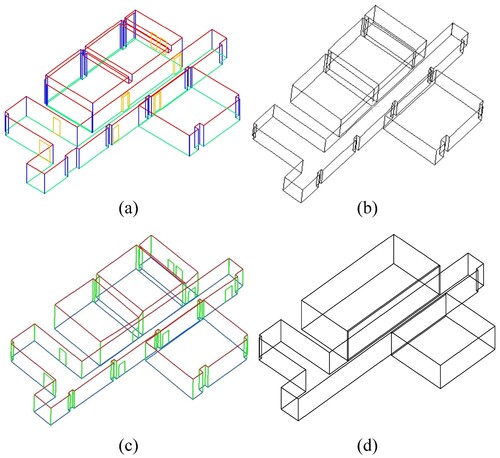
Table 5. The position error of points of Scene 2.
Table 6. The position error of points of Scene 3.
Figure 24. Semantic segmentation results optimization. (a) semantic point cloud with error segmentation. (b) semantic segmentation point cloud after processing.
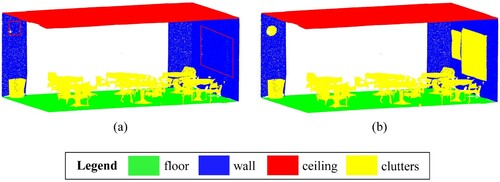
Figure 25. Illustration of selection.
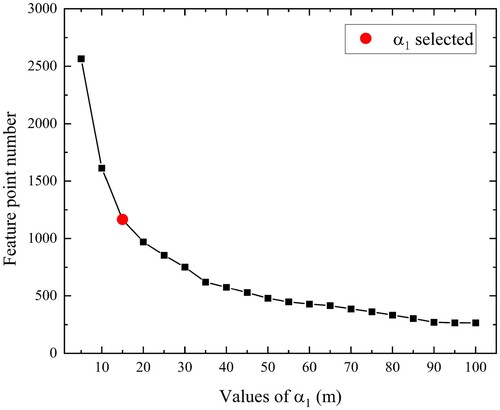
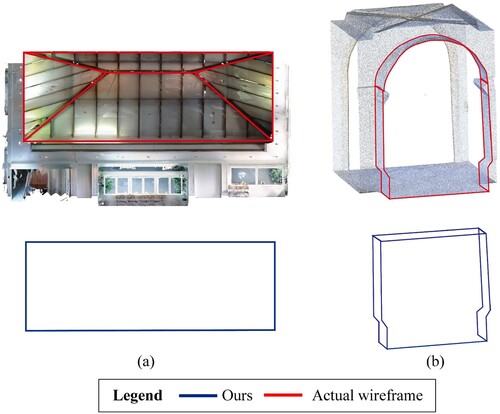
Figure 26. Illustration of non-horizontal structure. (a) the sloping roof that bulges in the middle of the building. (b) curved roofs.