Figures & data
Figure 1. The workflow for automatically identifying building structural types from UAV oblique photography images based on deep learning.
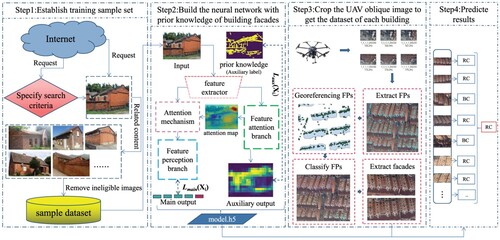
Figure 2. Data flow chart and web crawling object diagram for establishing the sample set.
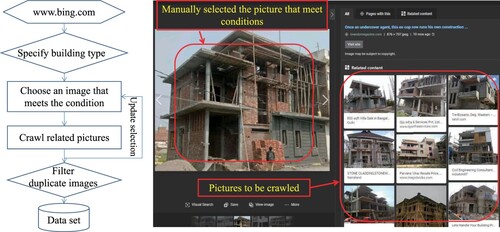
Figure 3. Examples of common classification of building structure types in China: (a) steel frame; (b) reinforced concrete shear wall; (c) reinforced concrete frame; (d) reinforced masonry; (e) unreinforced masonry.
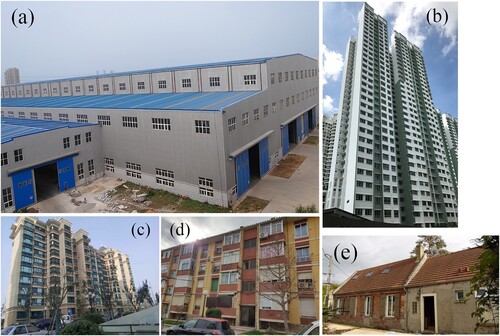
Figure 4. Structure of deep convolution network with building facade prior knowledge attention branch (PKAB) for identifying seismic building structural types.
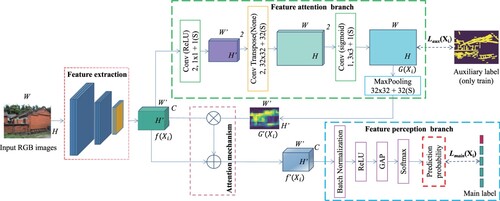
Figure 5. Flow chart of the method of automatically extracting building facades from the oblique image.
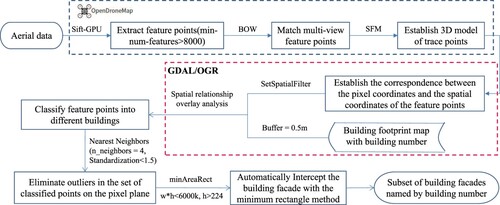
Figure 6. Extracting building facades from oblique images using feature points distribution. (a)Classification of feature points and distribution of outliers; (b)Classification of feature points after removing outliers. (The figure uses random different colors to show the feature points of different classifications, and uses a yellow circle to indicate that there are misclassification points.)
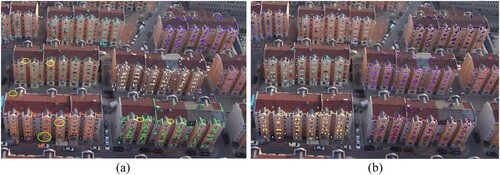
Figure 7. Direction gradient map of building facade. (a) The building facade extracted by the proposed method; (b) The binarized distribution map of x-direction gradient; (c) The binarized distribution map of y-direction gradient.
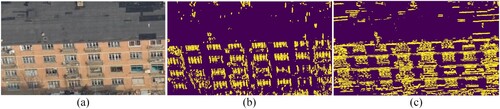
Figure 8. Devices used for obtaining the data and the orthoimage of datasets from the 3D high-resolution building model. (a) Four-rotor unmanned aerial vehicle (UAV); (b) Three-camera photography system; (c) The orthoimage of Area 1; (d) The orthoimage of Area 2.
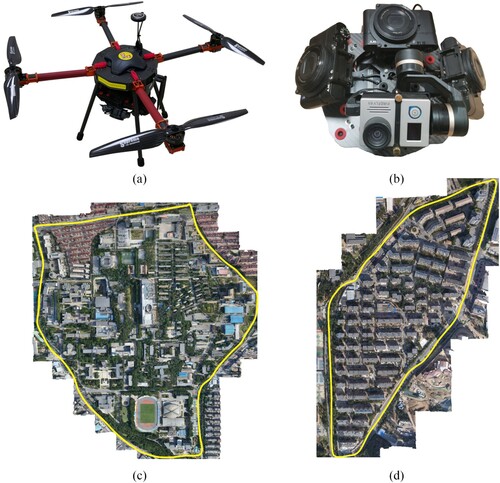
Table 1. Statistical table of the number of buildings of different building structure types in each area.
Table 2. The number of buildings of various structural types extracted by the building facade extraction metohd in different flight experiment cases.
Table 3. Evaluation results of building structural types based on different processing methods and model structures on Case 1. ().
Table 4. Evaluation results of building structural types based on different processing methods and model structures on Case 2. ().
Table 5. Evaluation results of building structural types based on different processing methods and model structures on Case 3. ().
Figure 9. Confusion matrix of building structural types identification using different processing methods and model structures on Case 1. (a) Xception + unprocess; (b) Xception + PKAB-net + unprocess; (c) Xception + process; (d) Xception + PKAB-net + process
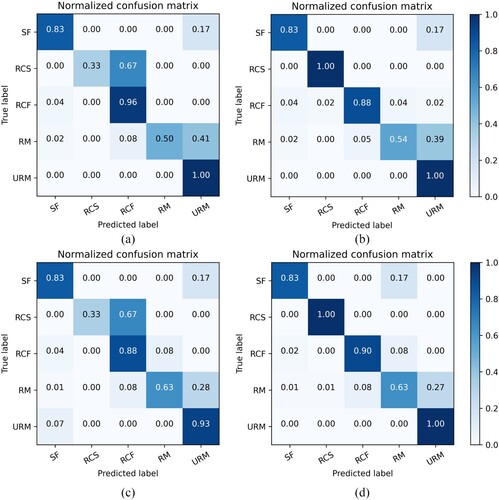
Figure 10. Confusion matrix of building structural types identification using different processing methods and model structures on Case 2. (a) Xception + unprocess; (b) Xception + PKAB-net + unprocess; (c) Xception + process; (d) Xception + PKAB-net + process.
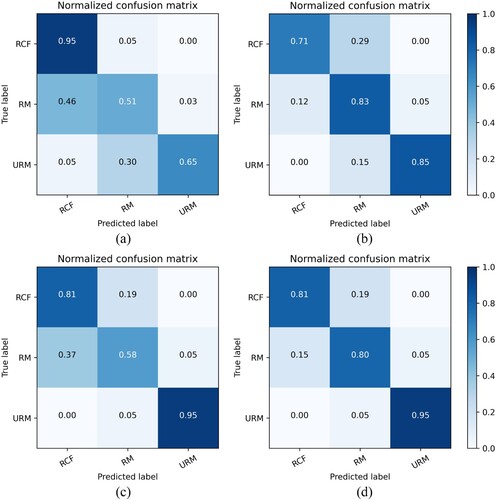
Figure 11. Confusion matrix of building structural types identification using different processing methods and model structures on Case 3. (a) Xception + unprocess; (b) Xception + PKAB-net + unprocess; (c) Xception + process; (d) Xception + PKAB-net + process
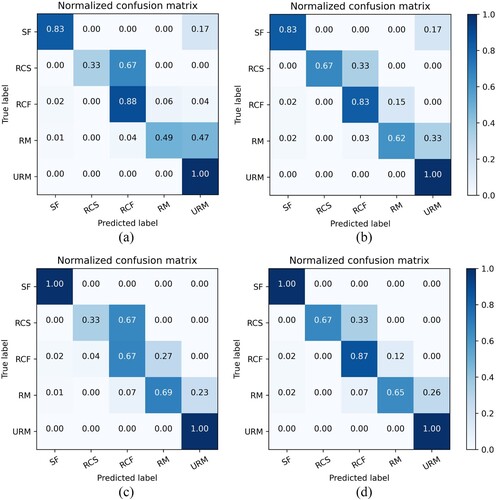
Table 6. Performance comparison of different benchmark models and attention mechanisms in three cases.
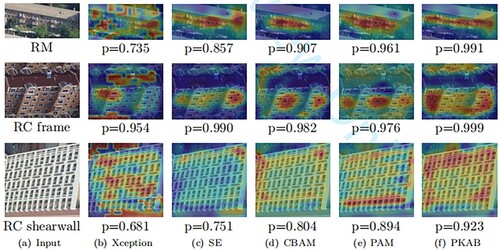
Figure 12. The CAM visualization results of integrated network based on the Xception model combined with each attention mechanism. The ground-truth label is displayed below each input image, and P represents the predicted score of each network for the ground-truth class.