
Figures & data
Figure 1. Experimental flowchart.
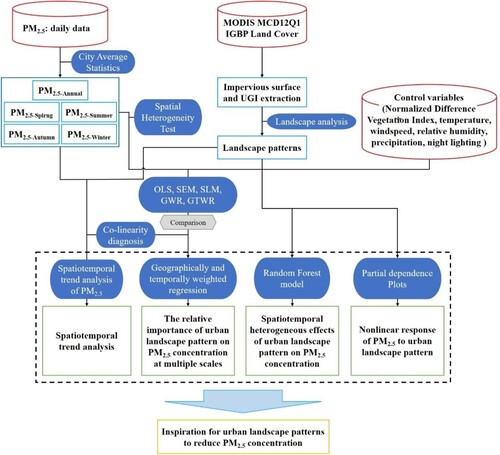
Figure 2. Study area location.
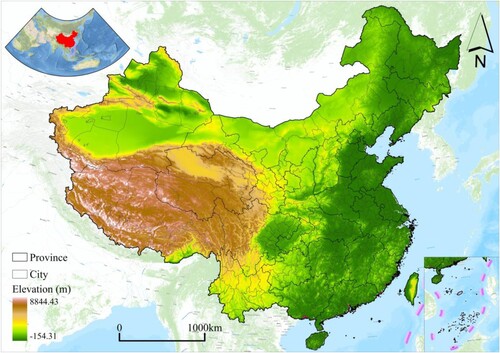
Table 1. Data summary.
Figure 3. Spatial distribution (a-e) and temporal trend (f) of PLAND-UGI regression coefficients.
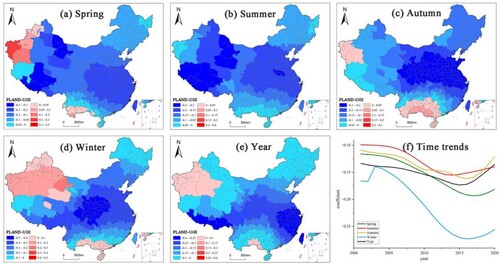
Figure 4. Spatial distribution (a-e) and temporal trend (f) of PLAND-Impervious regression coefficients.
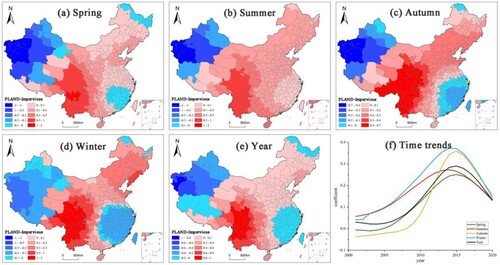
Figure 5. Spatial distribution (a-e) and temporal trend (f) of FRACT-UGI regression coefficients.
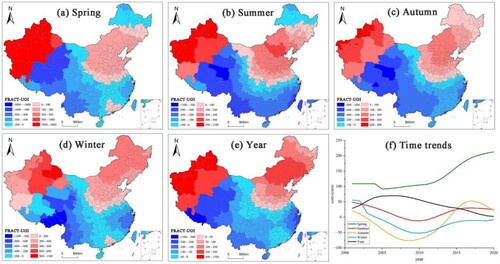
Figure 6. Spatial distribution (a-e) and temporal trend (f) of FRACT-Impervious regression coefficients.
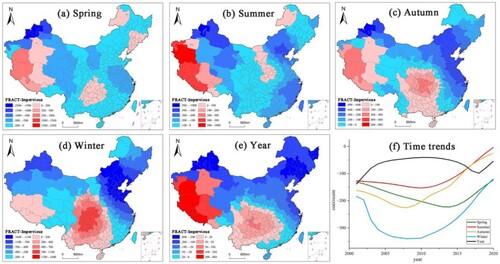
Figure 7. Spatial distribution (a-e) and temporal trend (f) of SHDI regression coefficients.
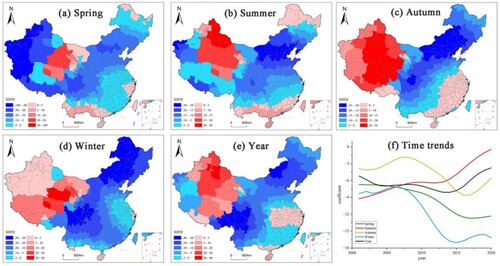
Figure 8. Contribution of urban landscape composition indices to PM2.5 concentrations during 2001–2020.
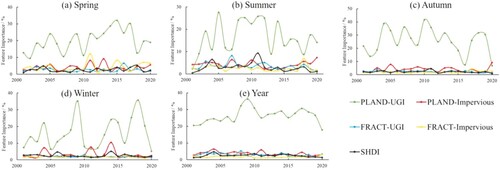
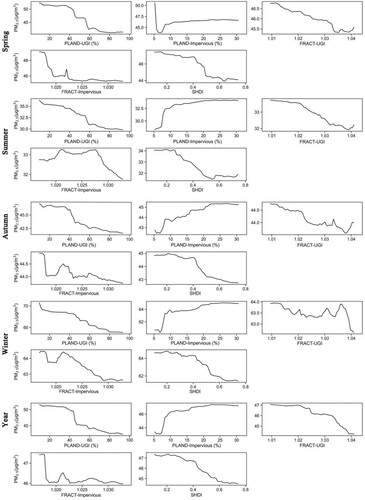
Figure 9. Marginal effects of urban landscape on PM2.5 concentration.
Supplemental Material
Download MS Word (69.3 MB)Data availability statement
Relevant data used for this study are available from the corresponding authors upon request.