Figures & data
Figure 1. The study area Aninkainen city block in the city of Turku in southwestern Finland. The oldest building (northern part) is a nursing home and was built in the 1890s. The Concert Hall (white oval building) and educational buildings (at the eastern part) from the 1950s will receive new functionalities in the current urban renewal process. Also new buildings are planned.
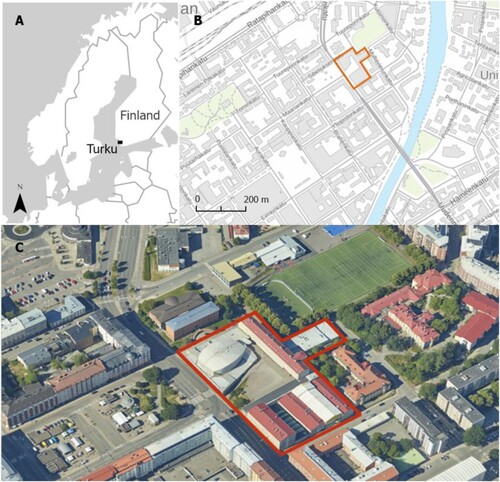
Figure 2. A screen capture from the 3D PPGIS survey. The 3D map view showed terrain, buildings, streets, trees and also the planned new buildings. The mapping task asked ‘What could be located in this area in the future?’ and the respondent could locate different development preferences as point markers in the 3D view.
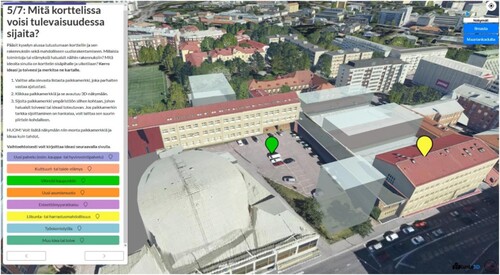
Figure 3. Relative share of different development preferences mapped in the 3D PPGIS survey across the Aninkainen area.
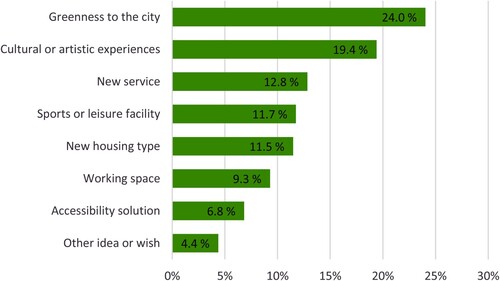
Figure 4. Learning data from city of Turku and the output extent.
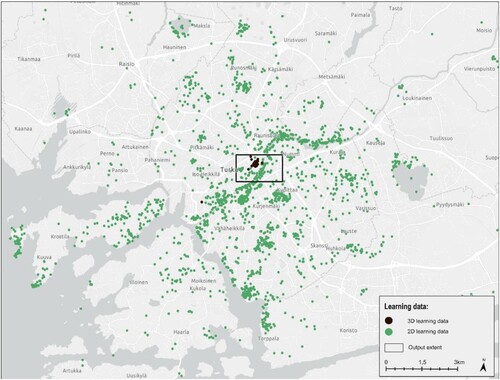
Figure 5. Exemplary outputs from some of the macro and micro scale metrics calculated with 3D PPGIS data.
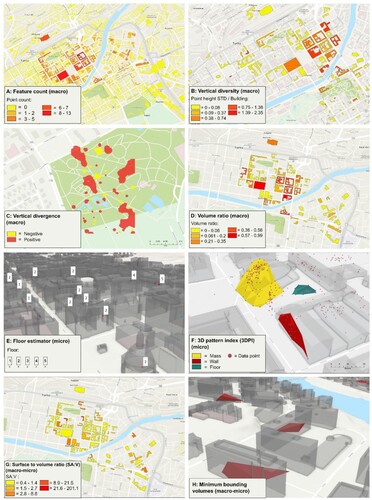
Table 1. Analytical framework: Macro and micro-scale analytical metrics for 3D PPGIS data.
Figure 6. Application of 3D PPGIS metrics in Aninkainen study area: (A) Vertical diversity expressed as the deviation of mean Z for points within the building, (B) An overview of markings within the block area, and (C) Average heights per marking type and classified vertical diversity
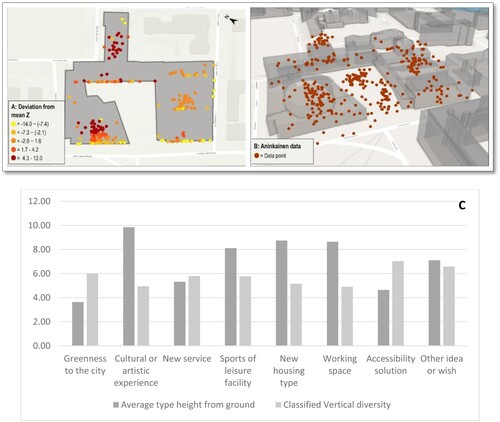
Figure 7. Application of 3D PPGIS metrics in Aninkainen study area: (A) Volume ratio and (B) type density measurements.
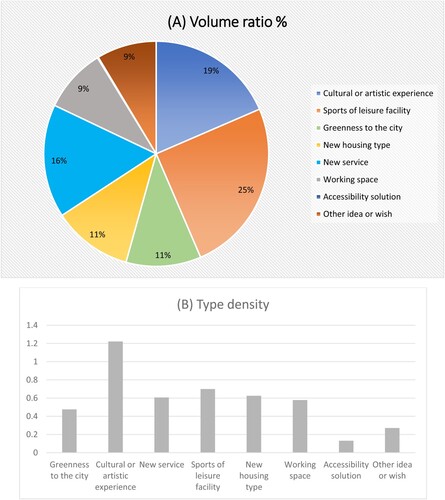
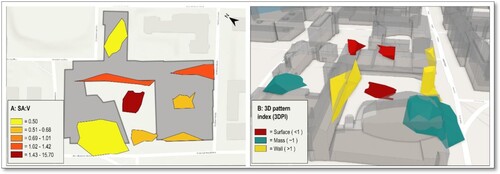
Figure 8. Clusters and 3D objects in Aninkainen. A: Surface to volume ratio (SA:V)., B: 3D pattern index (3DPI).