
Figures & data
Figure 1. Spatial distribution of 2153 meteorological stations and elevation (a), climate zones (b), annual average surface pressure (c), and the lowest vertical pressure level (d) in mainland China.
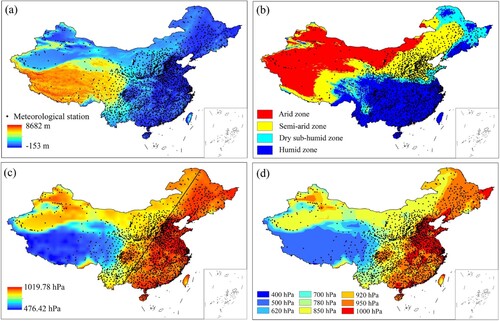
Figure 2. Flowchart of the methods we adopted for estimation.
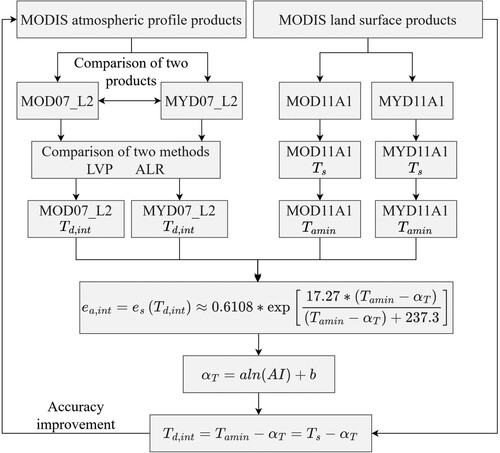
Table 1. Accuracy of MODIS atmospheric profile products for estimation.
Figure 3. Accuracy of retrieved from MOD07_L2 product at site scale and their scatterplots. (a) – (c) are R2, RMSE and B achieved by the LVP method, (d) – (f) are R2, RMSE and B achieved by the ALR method, and (g) – (i) are the scatterplots of R2, RMSE and B achieved by these two methods.
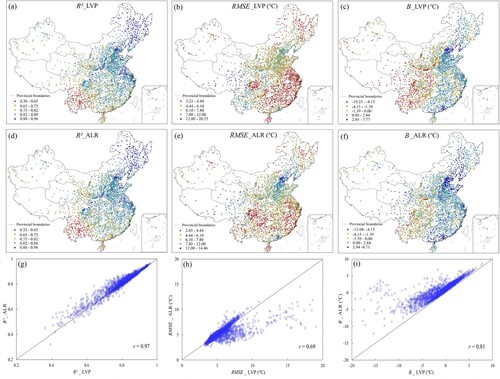
Figure 4. Logarithmic regression models between and AI for
estimation. (a) and (c) represent models calibrated by
and
observations, (b) represents model calibrated by
observations and MOD11A1 nighttime
, and (d) represents model calibrated by
observations and MYD11A1 nighttime
.
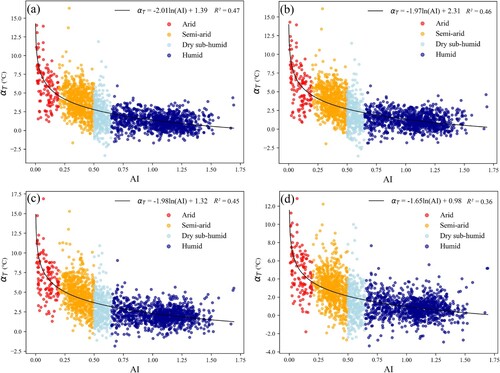
Figure 5. Accuracy of estimation achieved by different methods. (a) and (d) are the accuracy of
as a direct proxy for
, (b) and (e) are the accuracy of the correction method calibrated by
observations, and (c) and (f) are the accuracy of the correction method calibrated by MOD11A1 and MYD11A1
, respectively.
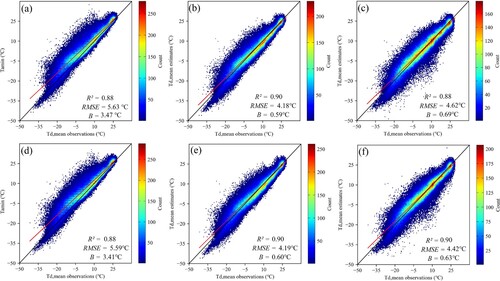
Table 2. Accuracy of daily mean dew pint temperature estimates achieved by different methods. The unit of RMSE and B is °C.
Figure 6. Logarithmic regression models between and AI for
estimation. (a) - (d) are models for
estimation at Terra overpass time, and (e) - (h) are models for
estimation at Aqua overpass time.
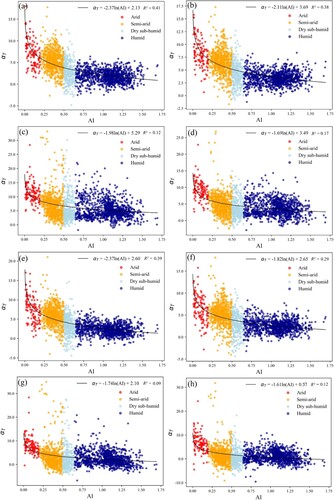
Table 3. Accuracy of instantaneous dew pint temperature estimates achieved by different methods. For simplicity, the estimated from
and
observations, from
observations and
, from
and
, and from
and
was renamed as
,
,
, and
, respectively. The unit of RMSE and B is °C.
Table 4. Accuracy of instantaneous dew pint temperature estimates achieved by different methods for the year 2017. and
represent the correction method developed from
and
and from
and
, respectively. The unit of RMSE and B is °C.
Figure 7. Accuracy of estimates achieved by correction methods at site scale and their scatterplots. (a) – (c) are R2, RMSE and B achieved by the
-based correction method, (d) – (f) are R2, RMSE and B achieved by the
-based correction method, and (g) – (i) are the scatterplots of R2, RMSE and B achieved by these two methods.
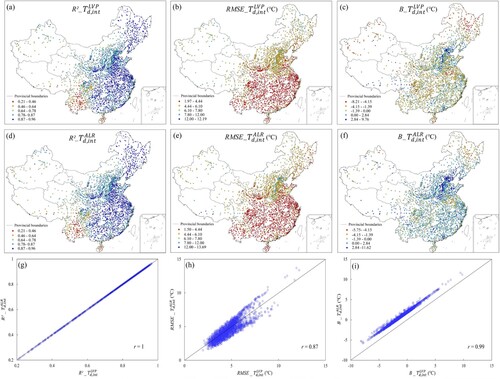
Figure 8. Accuracy of MOD11A1 (a) and MYD11A1 (b) nighttime as the proxy for
.
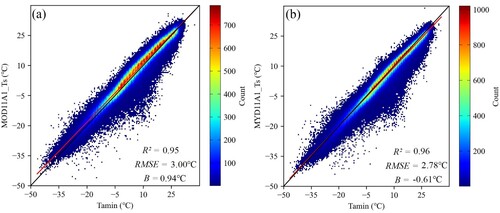
Figure 9. Relationships of the RMSE achieved by different estimates with each other and their variations with AI. (a) and (b) are the scatterplots of the RMSE achieved for and
estimation with the RMSE achieved for
estimation, respectively. (c) is the scatterplots of the RMSE achieved for
estimation with the RMSE achieved by
. (d) – (f) are the variations of the RMSE achieved by
,
and
estimation with AI, respectively.
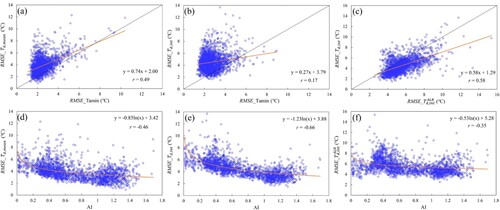
Figure 10. Spatial distribution of annual average estimation and RMSE as well as their accuracy across all sites. (a) and (b) are the spatial distribution of annual average
and
estimation, (c) and (d) are the accuracy of annual average
and
estimation across all sites, and (e) and (f) are the spatial distribution of the average RMSE retrieved from the logarithmic regression models in (d,e).
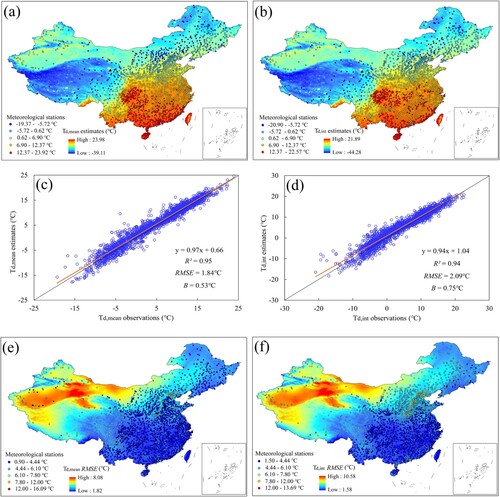
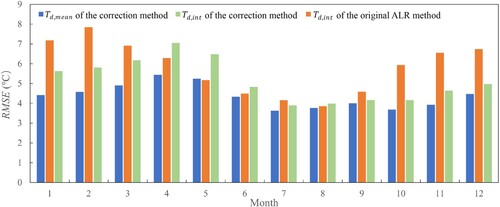
Figure 11. Seasonal variations of the RMSE achieved by the ALR and correction methods.
Data availability statement
MODIS products were obtained from https://ladsweb.modaps.eosdis.nasa.gov/archive/allData/61, meteorological observations were obtained from the China Meteorological Data Service Center at http://data.cma.cn/en/?r=data/detail&dataCode=J.0019.0010.S002, and aridity index dataset was obtained from https://cgiarcsi.community/data/global-aridity-and-pet-database/.