
Figures & data
Figure 1. Location of the Phu Tho province and flooded locations.
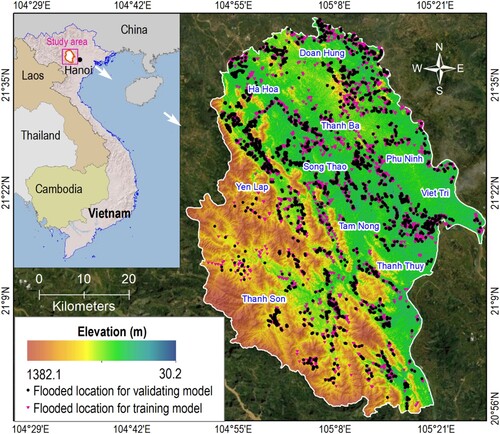
Table 1. Accuracy and loss results for the selected parameters for each model.
Table 2. Accuracy and loss results obtained for each model in the evaluation phase.
Figure 3. Flash-flood susceptibility map using deep learning methods. (a) U-Net model; (b) WU-Net model and (c) U-Net++ model.
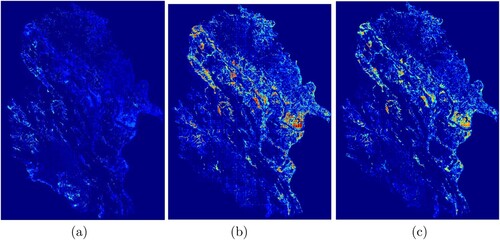
Figure 4. Flood susceptibility map of U-Net divided in four ranges of probability (20%, 40%, 60% and 80%).
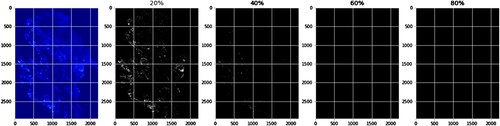
Figure 5. Flood susceptibility map of U-Net divided in four ranges of probability (5%, 10%, 15% and 20%).
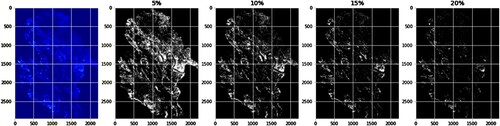
Figure 6. Flood susceptibility map of WU-Net divided in four ranges of probability (20%, 40%, 60% and 80%).
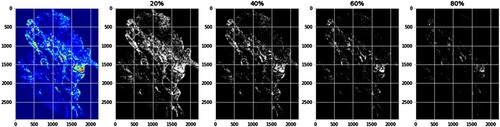
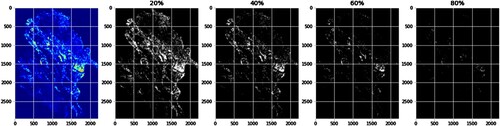
Figure 7. Flood susceptibility map of U-Net++ divided in four ranges of probability (20%, 40%, 60% and 80%).
Data availability statement
The data that support the findings of this study are available from the corresponding author upon reasonable request.