
Figures & data
Figure 1. Illustration of the processes that take place at a satellite ground station network.
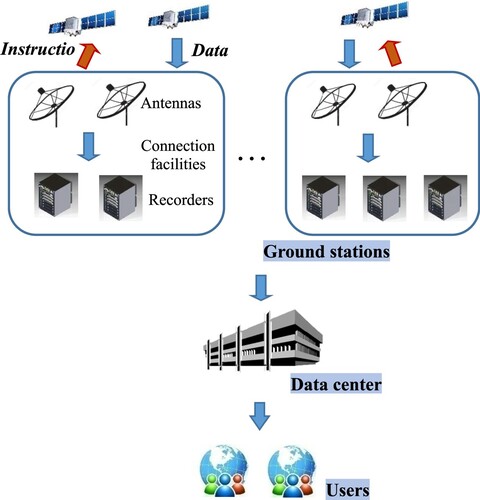
Figure 2. Map of the relationships between missions and facilities.
Notes: The green lines denote the available connections between satellites and antennas; the purple lines denote the available connections between satellites and demodulators; the red lines denote the available connections between satellites and loggers; the black lines denote the available connections between antennas and demodulators; the blue lines denote the available connections between demodulators and loggers.
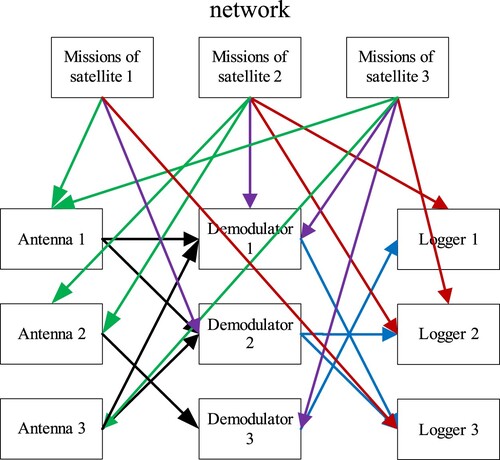
Table 1. Prioritization of available facilities, showing the weights assigned to different facilities.
Table 2. Improved prioritization of facilities with load balancing considered.
Table 3. Improved facility prioritization with load balancing and signal confliction considered.
Figure 3. Overall framework of the decomposition algorithm.
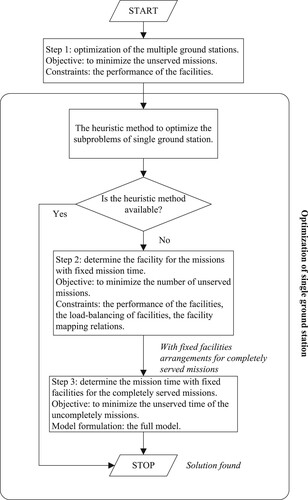
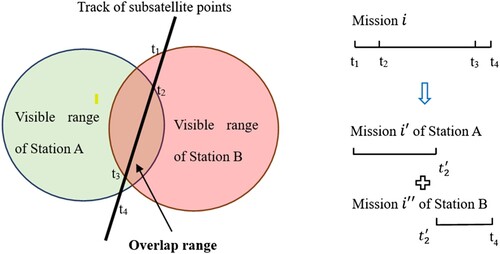
Figure 4. (a) Diagram showing the visible range of two ground stations A and B and (b) the decomposition of relay missions.
Table
Figure 5. Flowchart showing the scheduling optimization process for a single ground station.
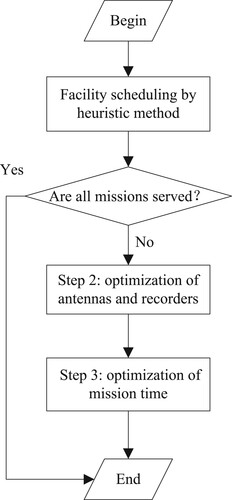
Figure 6. Diagram of facility scheduling based on heuristic rules.
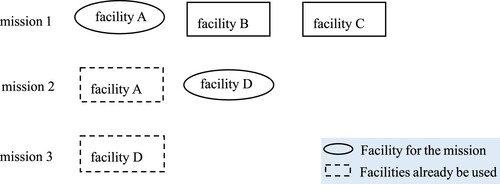
Table 4. The numbers of missions and satellites in the analyzed cases.
Table 5. Number of facilities for the ground stations.
Table 6. PSO parameters.
Table 7. Objective values for the proposed algorithm and GA.
Table 8. Relative percentage differences of objective values and computational times for the two approaches.
Table A1. Comparison between number and lengths of completed missions for the genetic algorithm and proposed algorithm.
Table A2. Scheduling results for a selection of the missions from case 1.
Table A3. Facility sets available for missions.
Table A4. Scheduling results obtained using the genetic algorithm.
Table A5. Scheduling results obtained using the proposed algorithm.