
Figures & data
Figure 1. Study area.
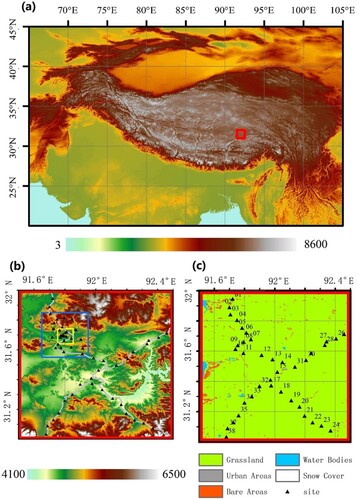
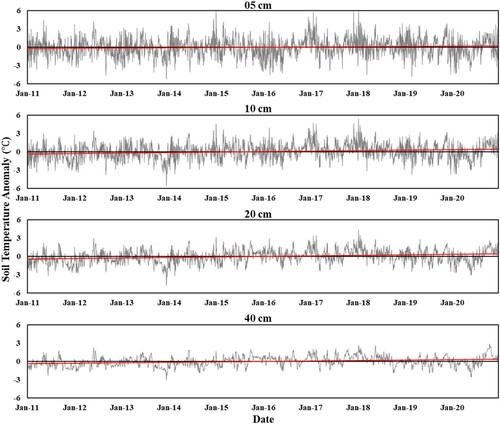
Figure 2. Temperature distribution at different depths (05, 10, 20, 40 cm).
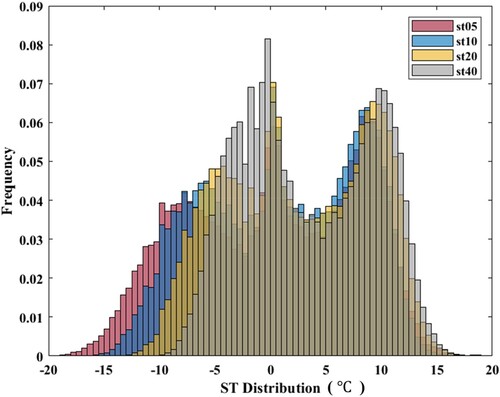
Table 1. Bandwidth and spatial resolution of MODIS and Landsat corresponding bands.
Figure 3. Flow chart of this study.
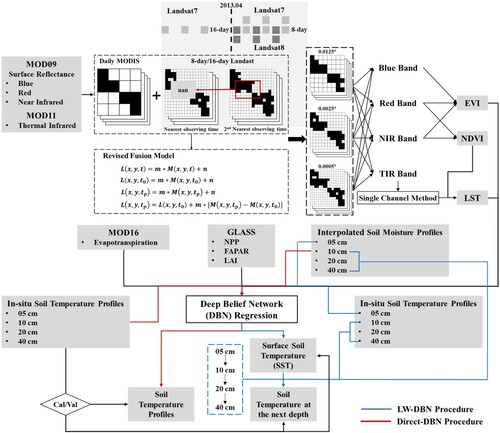
Table 2. R2 of two approaches at different depths and scales.
Table 3. RMSE () of two approaches at different depths and scales.
Table 4. MAE () of two approaches at different depths and scales.
Figure 4. Comparisons between the observed and predicted ST. (a) Scatter plot between observed and predicted ST, and (b) histogram of bias for predicted ST.
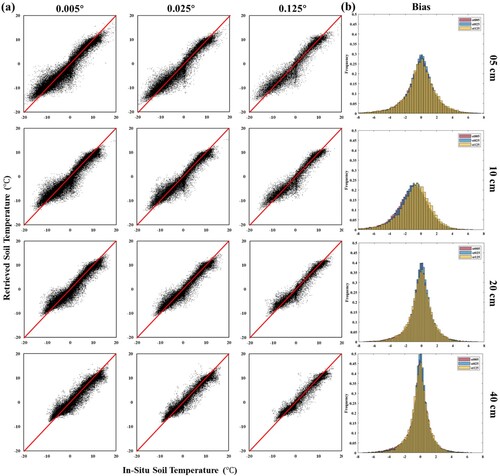
Figure 5. Time series of predicted and observed ST at station MS3488.
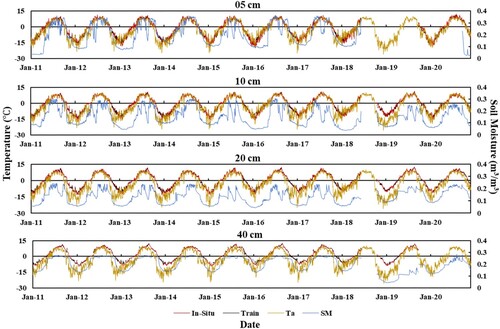
Figure 6. (a) R2, (b) RMSE, and (c) MAE for different months.
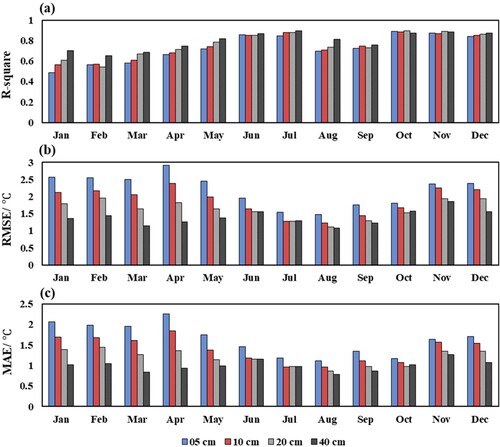
Figure 7. Spatial distribution of predicted annual mean ST at a depth of 5, 10, 20, and 40 cm in 2011, 2014, 2017, and 2020. (unit: ).
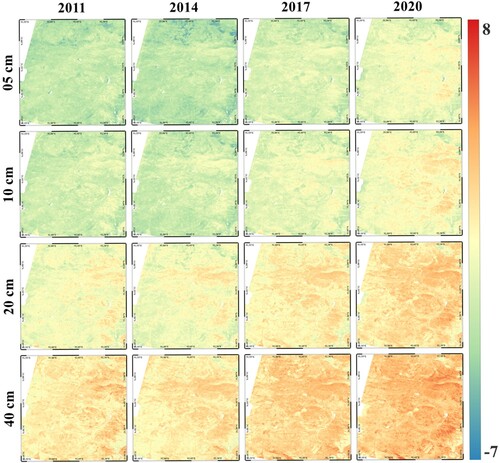
Figure 8. Spatial distribution of estimated surface ST on July 24th, 2015, for three spatial resolutions (0.0125°, 0.0025°, and 0.0005°).
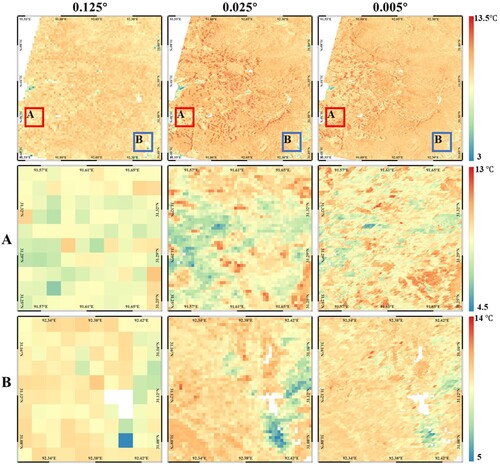
Figure 9. ST’s rising trend at 5, 10, 20, and 40 cm.
Data availability
The data that support the findings of this study are openly available in NASA MODIS Portal (https://modis.gsfc.nasa.gov/), USGS Landsat Portal (https://earthexplorer.usgs.gov/), the Global land surface satellite products (http://www.glass.umd.edu/index.html), the Tibetan Plateau Science Data Center, National Earth System Science Data Sharing Infrastructure, National Science & Technology Infrastructure of China (http://tibet.geodata.cn).