
Figures & data
Figure 1. Factors influencing tourist movement predictability (G. Lau and McKercher Citation2006).
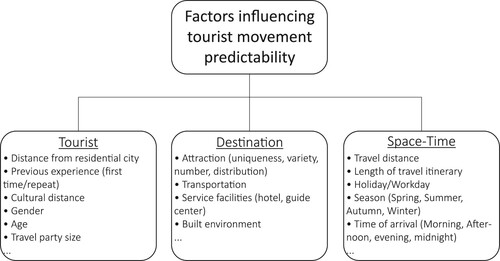
Figure 2. Study area and Sina Weibo dataset. (a) The location of Suzhou on the scale of Country. (b) The location of Suzhou on the scale of Province. (c) The location of sites in Suzhou and (d) The geo-tagged microblogs in Suzhou.
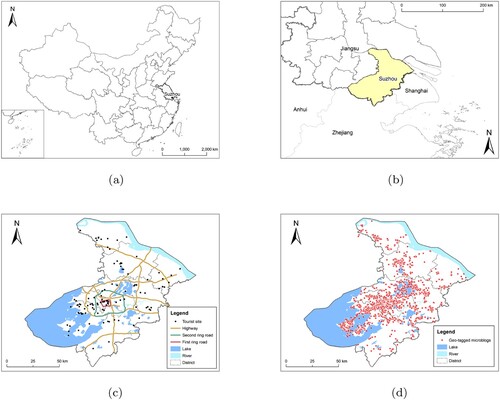
Figure 3. Diagram of trajectory division.
Note: The number in the circles is the date index. The circles indexed as 1,9,12 are the dates when the microblogs posted in the tourist's residence city. The circles indexed as 3,7,15,17,18,19 are the dates when microblogs were not posted. The other circles are the dates when microblogs were posted in the destination city.
Figure 4. LSTM model architecture.
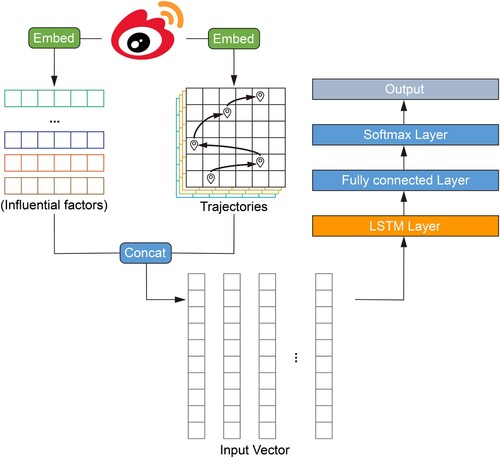
Figure 5. The training loss and testing loss of our model.
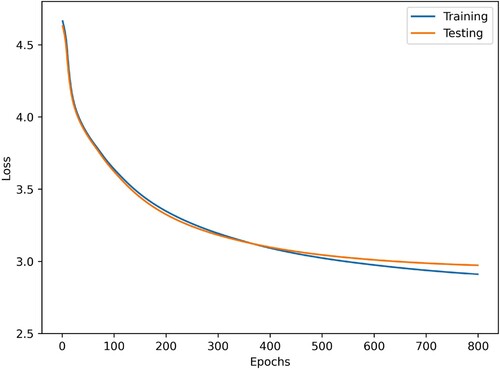
Figure 6. Boxplots of Top@1, Top@3, and the MRR for the prediction results of the LSTM model with tourist features.
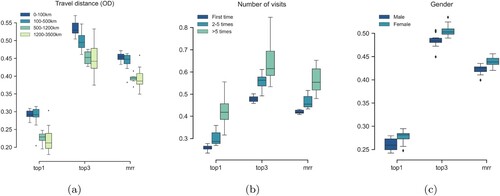
Figure 7. Boxplots of Top@1, Top@3, and the MRR for the prediction results of the LSTM model with destination features.
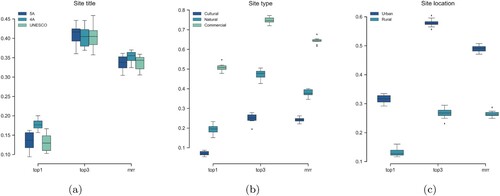
Figure 8. Boxplots of Top@1, Top@3, and the MRR for the prediction results of the LSTM model with time features.
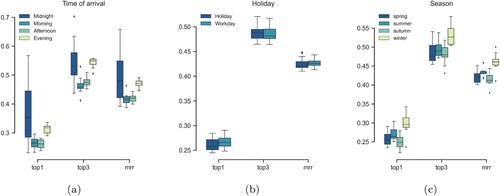
Figure 9. Trajectory length distribution.
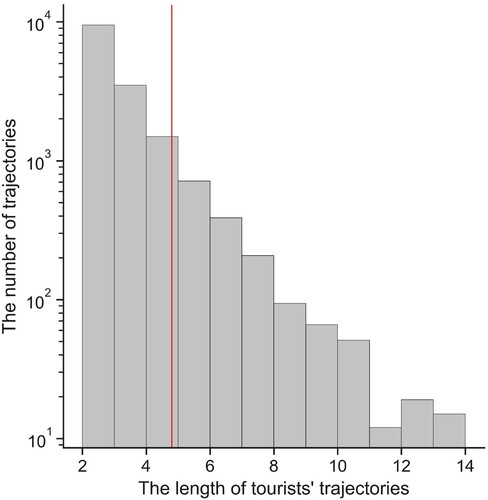
Figure 10. Distribution of tourists' travel distance (S).
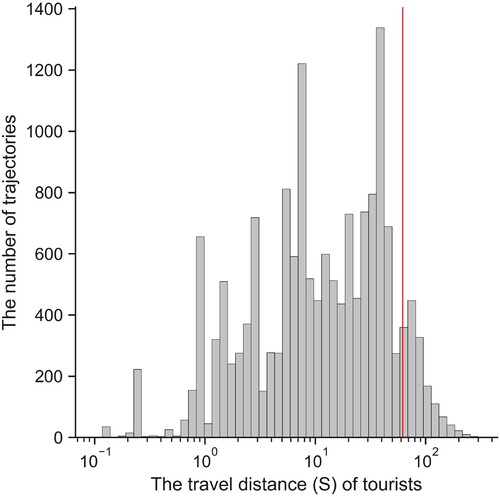
Figure 11. Length of tourist trajectories and the Top@1, Top@3, and MRR of the prediction.
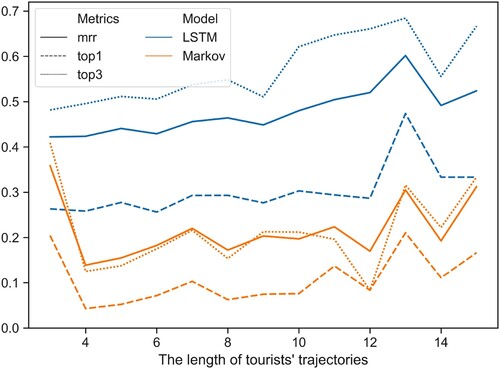
Figure 12. Travel distance (S) of tourists and the Top@1, Top@3, and MRR of the prediction.
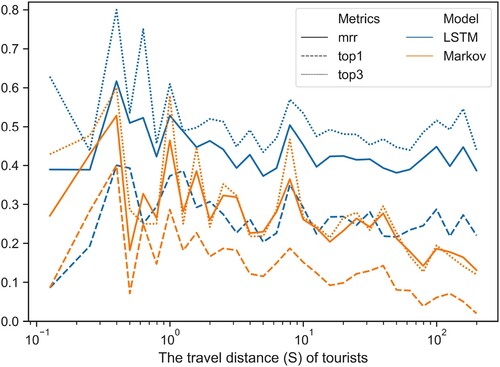
Figure 13. Relationship of the distance between sites and MRR at the local level.
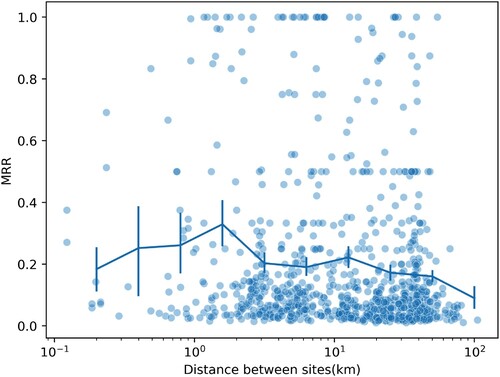
Figure 14. Preference of tourist with different features for site types.
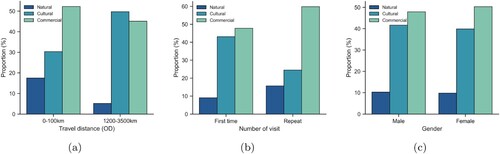
Figure 15. Site types in Suzhou.
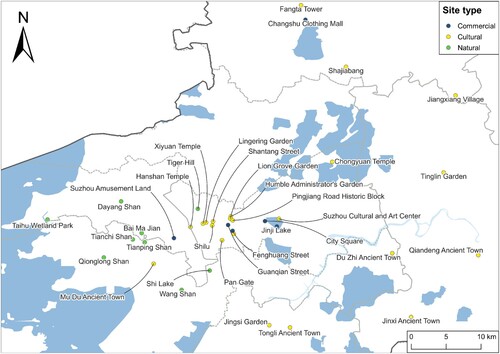
Table 1. Summary of the impact of factors on tourist movement prediction.