
Figures & data
Figure 1. Jiuzhaigou MS7.0 Earthquake. (a) The map shows the location of Jiuzhaigou, (b) Tectonic setting of the 2017 Jiuzhaigou MS7.0 Earthquake (modified by Guo et al. Citation2021b). MJF: Minjiang Fault, NHYF: North Huya Fault, TZF: Tazang Fault.
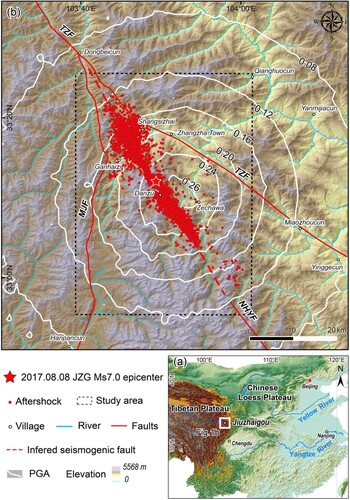
Table 1. Remote sensing data used in this study.
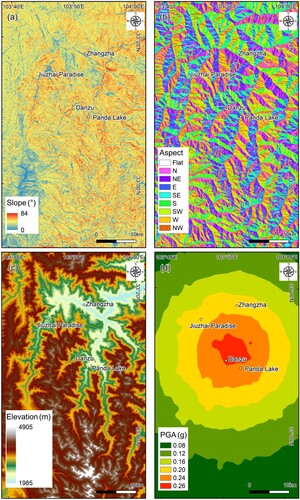
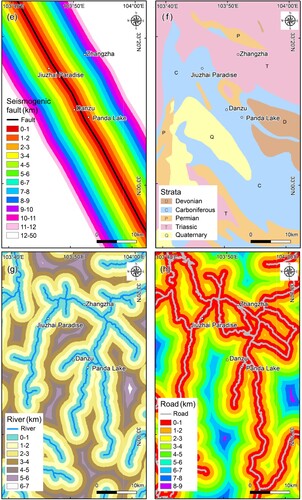
Figure 3. Procedural flow chart of this study.
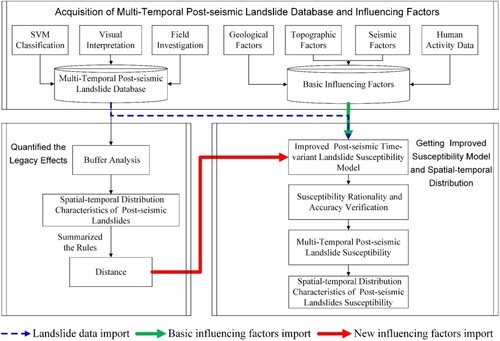
Figure 4. Example of 2017–2019 post-seismic landslides distribution buffer analysis.
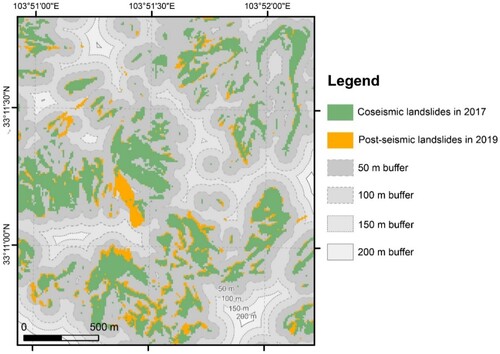
Figure 5. Remote sensing images and field photo around Five Flower Lake. (a) 2013, (b) 2017, (c) 2020, (d) Field photo.
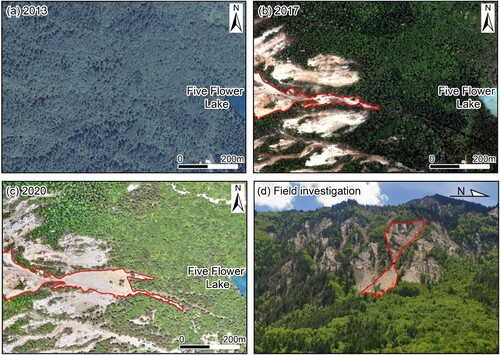
Figure 6. Remote sensing images and field photo around Mirror Lake. (a) 2013, (b) 2017, (c) 2020, (d) Field photo.
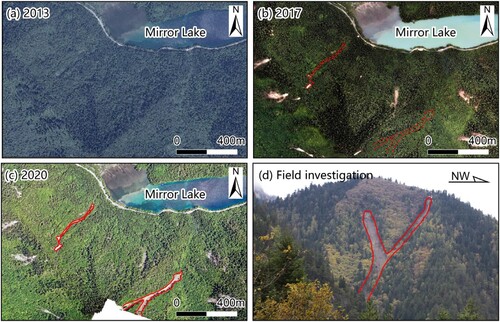
Figure 7. Remote sensing images and field photo around Heye community. (a) 2013, (b) 2017, (c) 2020, (d) Field photo.
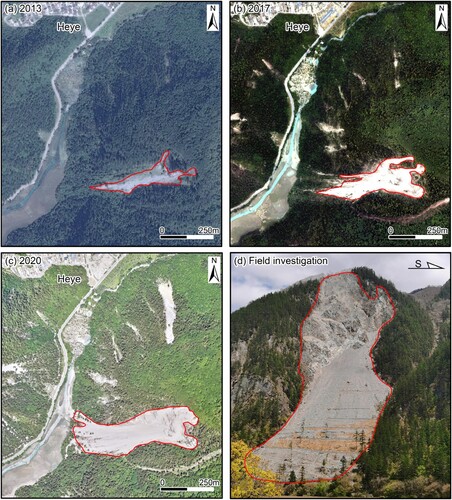
Figure 8. Landslides area distribution after the 2017 Jiuzhaigou MS7.0 earthquake. (a) 2017, (b) 2019, (c) 2020.
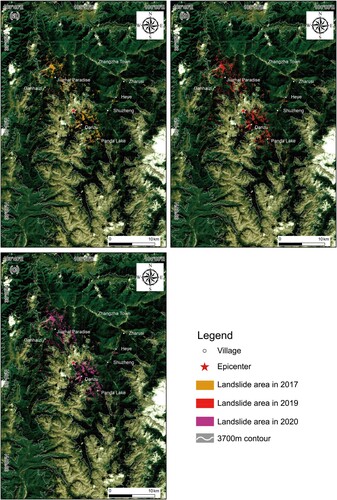
Figure 9. Post-seismic landslides. 2017–2019: (a) The Jiuzhaigou region, (b) The Jiuzhai Paradise region, (c) The Panda Lake region; 2019–2020: (d) The Jiuzhaigou region, (e) The Jiuzhai Paradise region, (f) The Panda Lake region.
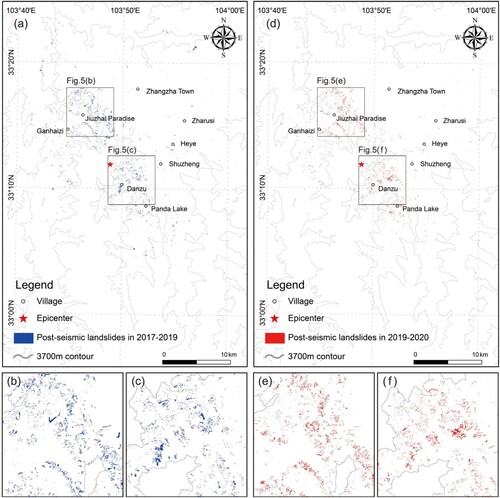
Figure 10. Spatio-temporal distribution percentage of post-seismic landslides.
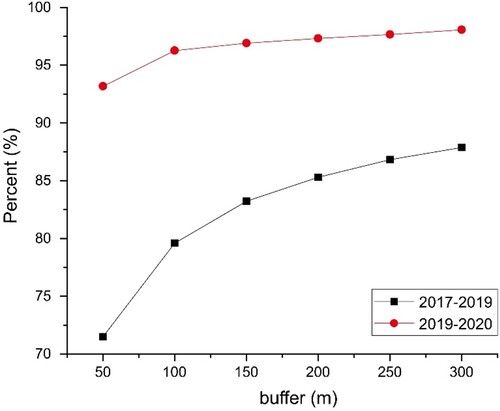
Figure 11. Examples of post-seismic landslides. Five-Flower Lake landslide edge: (a) 2017, (b) 2020; Heye landslide edge: (c) 2017, (d) 2020; Shuzheng landslide edge: (e) 2017, (f) 2020.
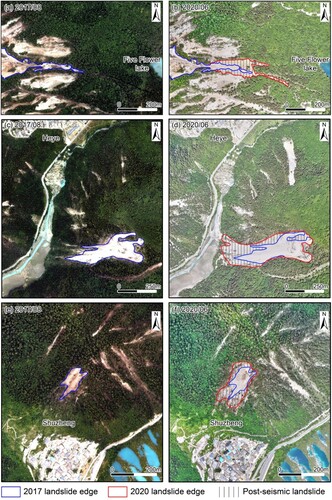
Table 2. Spatio-temporal distribution of post-seismic landslides in 2017–2019 and 2019–2020.
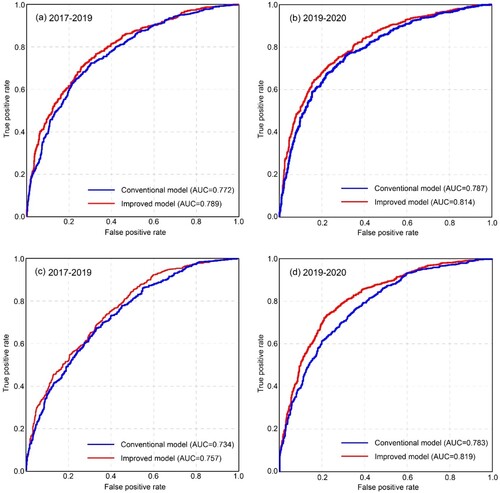
Figure 13. Post-seismic landslide susceptibility calculated by the improved time-variant landslide susceptibility model. (a) 2017–2019, (b) 2019–2020.
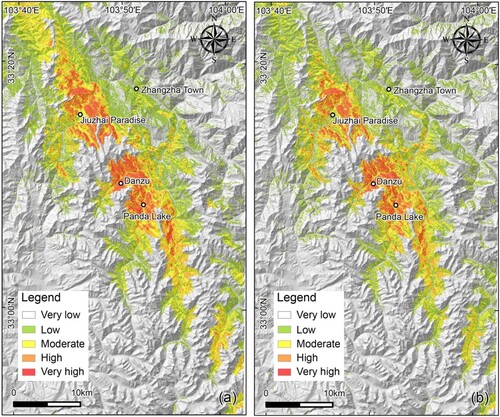
Figure 14. Post-seismic landslide susceptibility calculated by conventional landslide susceptibility model. (a) 2017–2019, (b) 2019–2020.
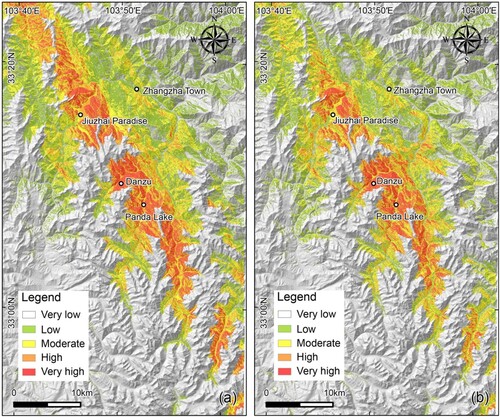
Figure 15. Coseismic landslide susceptibility in 2017 (modified by Guo et al. Citation2021c).
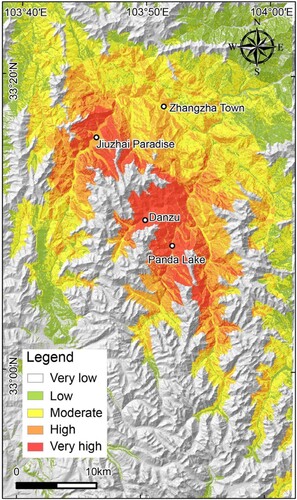
Table 3. Changes of post-seismic landslide susceptibility distribution by the improved landslide susceptibility model.
Table 4. Changes of post-seismic landslide susceptibility distribution by the conventional landslide susceptibility model.
Table 5. 2019–2020 post-seismic landslides distributed in post-seismic landslide susceptibility classification area of 2017–2019.
Table 6. Ranking of Pearson correlation coefficient in improved time-variant landslide susceptibility model.
Figure 16. Diagram showing the development of the new single post-seismic landslides. (a) Slope without landslide, (b) New single post-seismic landslides (uw: Pore water pressure).
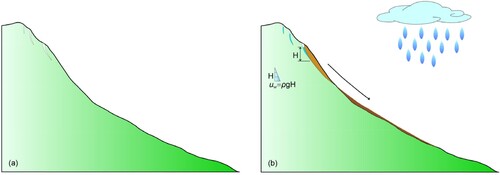
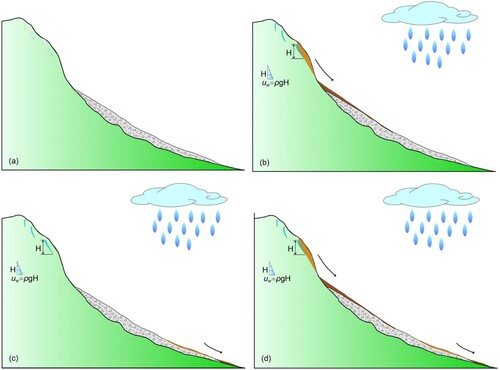
Figure 17. Diagram showing the development of the pre-phase landslides expansion. (a) Coseismic landslide, (b) Post-seismic landslide caused by cracks propagation, (c) Post-seismic landslide caused by deposits movements, (d) Post-seismic landslides caused by cracks propagation and deposits movements (uw: Pore water pressure).
Data availability statement
The data that support the findings of this study are available from the corresponding author, upon reasonable request.