
Figures & data
Figure 1. Study Area.
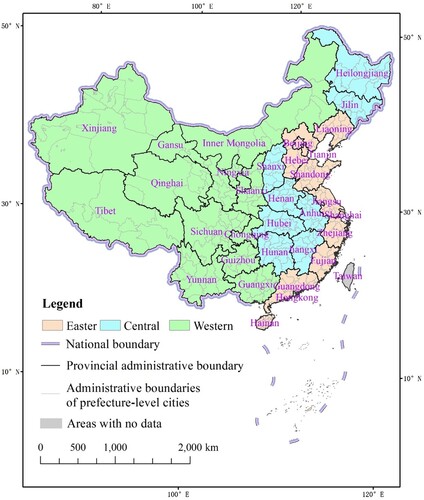
Figure 2. The distribution of intercity (a) population flows, (b) traffic flows, (c) information flows, and (d) fusion flows.
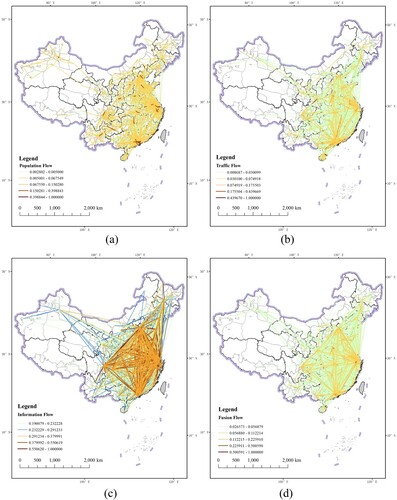
Figure 3. Diamond structure formed by the flows.
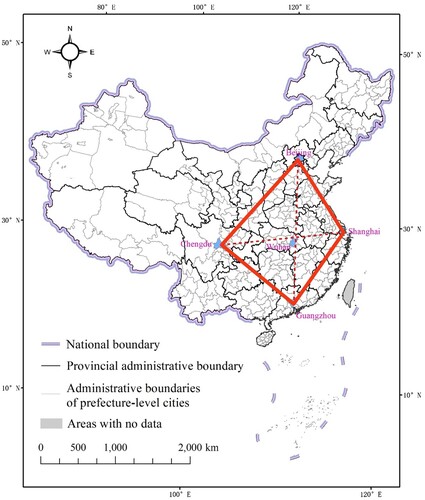
Figure 4. Silhouette coefficient of each step.
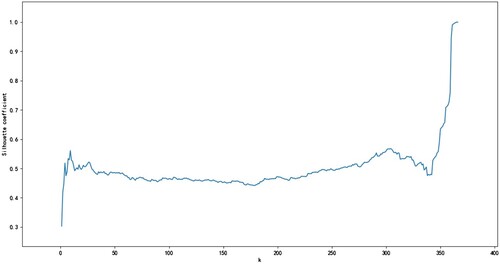
Figure 5. The results of city community detection based on the fusion flow.
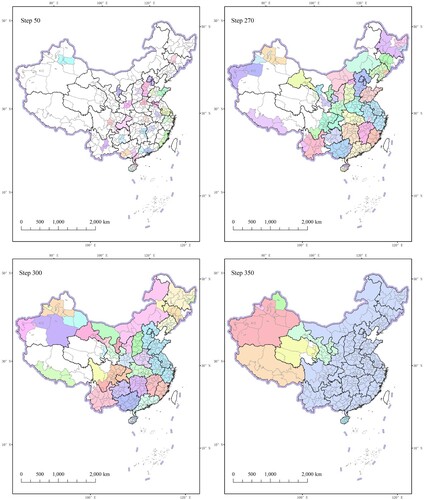
Table 1. Correlation between population flow, traffic flow, information flow, and fusion flow.
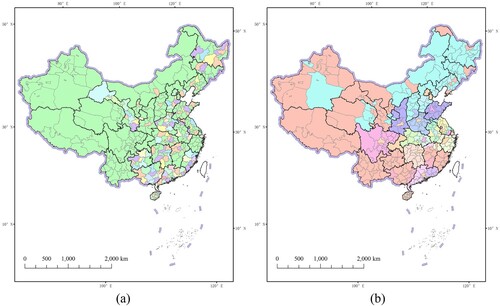
Figure 6. The results of city community detection based on population flow.
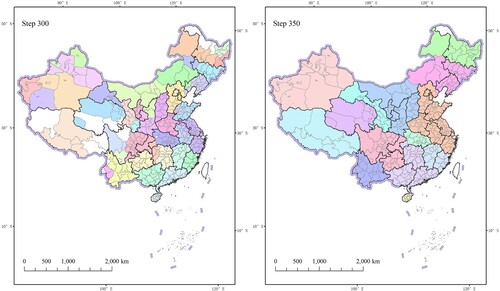
Figure 7. The results of city community detection based on traffic flow.
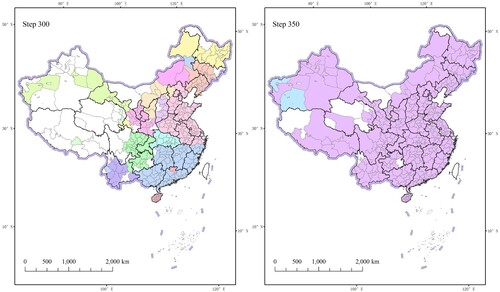
Figure 8. The results of city community detection based on information flow.
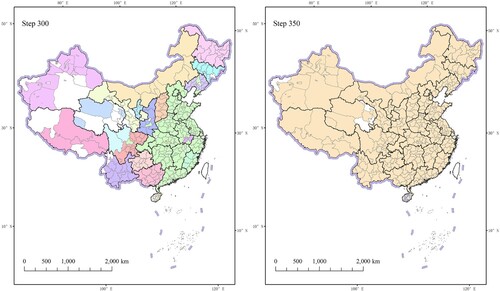
Figure 9. The results of city community detection based on (a) Louvain algorithm, (b) spectral clustering algorithm.
Data availability statement
The data that support the findings of this study are openly available in Figshare (https://figshare.com/articles/dataset/Multisource_flow_data/22598074; DOI: 10.6084/m9.figshare.22598074).