
Figures & data
Figure 1. Workflow of the LULC product update using LandTrendr and CCDC, and optimization using the statistics space allocation method.
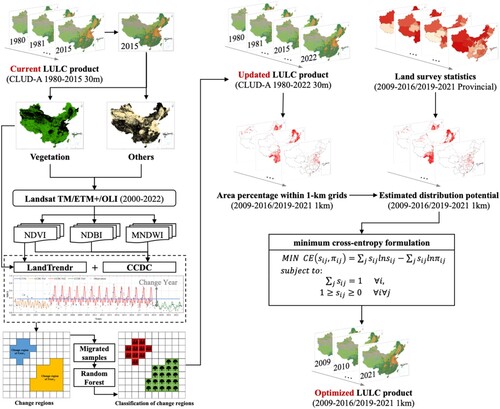
Figure 2. Change detection examples for a single pixel (the red dot on the true color combined Sentinel 2 images or Google Earth images on the blow). The combination of CCDC and LandTrendr can (a) filter out abrupt vegetation LULC changes detected by CCDC in Baoding, Hebei Province; (b) complement slow vegetation restoration undetected by CCDC in Yuanping, Shanxi Province; and (c) complement new buildings undetected by LandTrendr in Tangshan, Hebei Province.
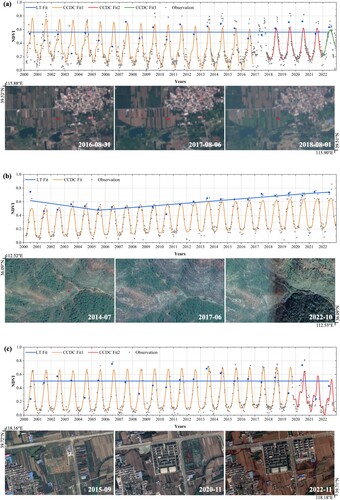
Figure 3. The workflow of land use/land cover (LULC) map optimization using the statistics space allocation method with Shaanxi Province as an example. (IDW: inverse distance weighted)
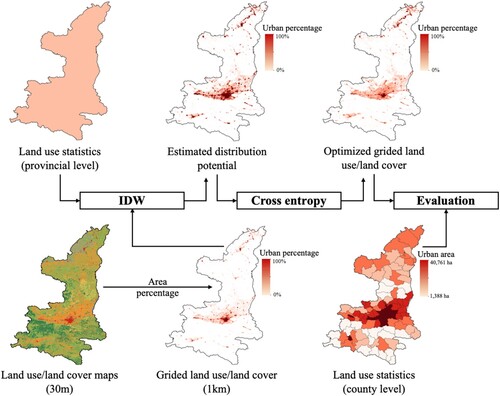
Figure 4. Updated annual land use/land cover (LULC) maps of 2022 in China (for 2016–2021 maps, please see Figure S1.)
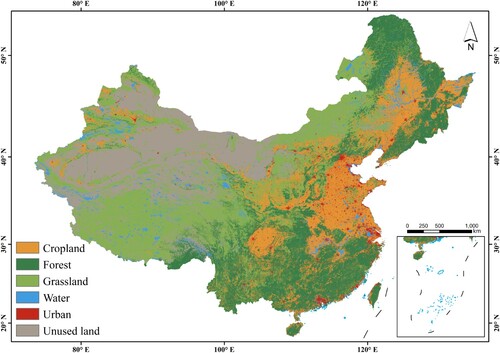
Figure 5. Annual area changes of CLUD-A, CLCD, and ESA CCI LC by different LULC types from 2010 to 2022.
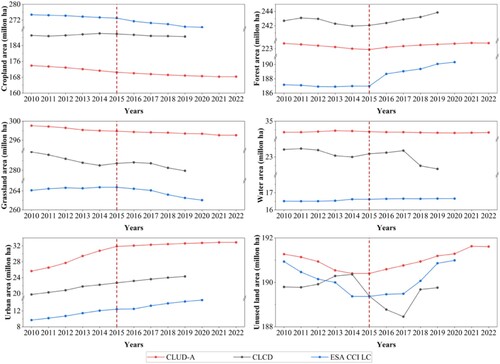
Figure 6. Annual sample size and overall accuracy of updated CLUD-A (2010–2022).
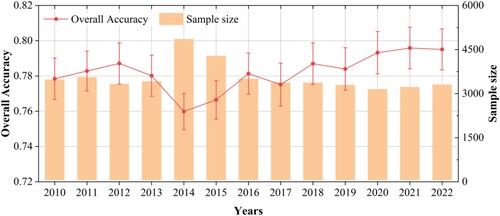
Figure 7. Examples of LULC changes during 2015–2022. (a) Construction of agricultural facilities in Shannan, Tibet; (b) water expansion caused by the construction of water conservancy infrastructure in Xinyang, Henan; (c) newly reclaimed cropland in Hangzhou, Zhejiang; (d) construction of Beijing Daxing International Airport.
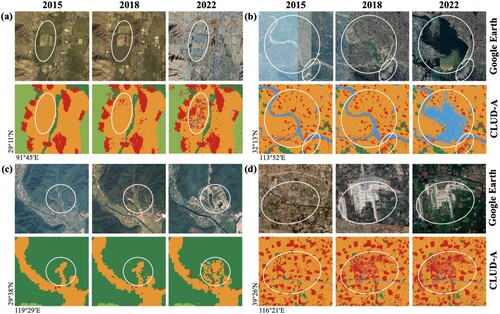
Figure 8. Optimized land use/land cover (LULC) maps of China during 2009–2016 and 2019–2021.
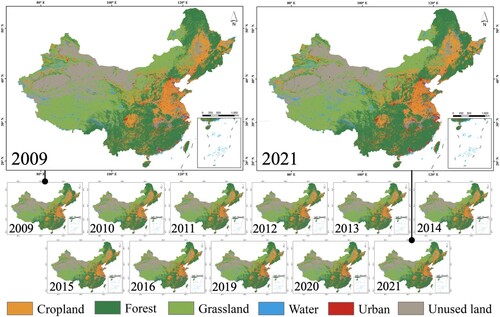
Figure 9. Comparison of the consistency of classified and statistical areas before and after optimization using the comparison of (a)–(e) area and (g) Area Angle Distance (AAD) of (f) five provinces, and (h) spatial distribution of forest percentage in Huanglong County, Yan’an, Shaanxi Province.
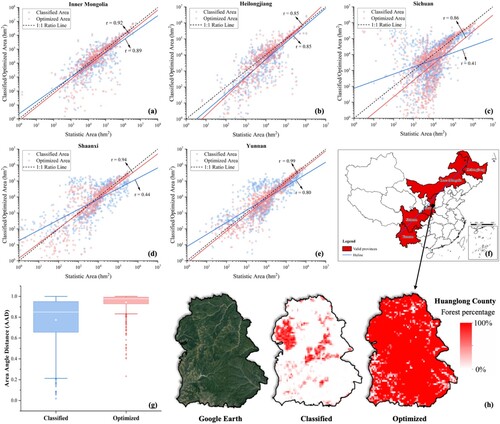
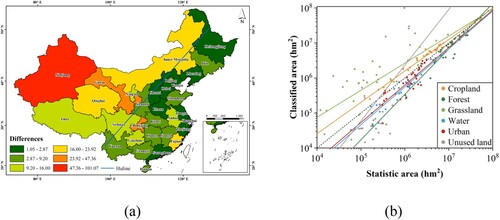
Figure 10. The differences between remote sensing classification maps and provincial land survey statistics for each LULC type in Chinese provinces. (a) Differences for each province; (b) linear fit results for each LULC type.
Supplemental Material
Download MS Word (1.4 MB)Data availability statement
The data supporting the findings of this study are available from the corresponding author upon reasonable request.