
Figures & data
Figure 1. Main stages of the TFPM method. (a) Point clouds with a gap. (b) Detected gap boundary points. (c) Extracted topographic feature points (ridge). (d) A curve fitted using the extracted topographic feature points within the gap. (e) Topographic feature point interpolation and the segmented gap. (f) Patch matching for each segmented target patch.
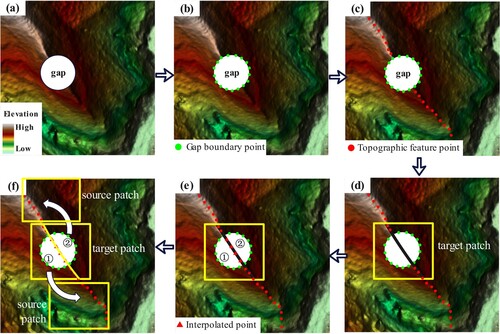
Figure 2. Information on the TFPM method. (a) Topographic features. (b) Grid strategy used in gap boundary detection. (c) Target patch generation. (d) Source patch generation. (e) Central point and its neighbouring points. (f) Gently sloped areas in a valley. (g) The flowchart of the topographic feature extraction method.
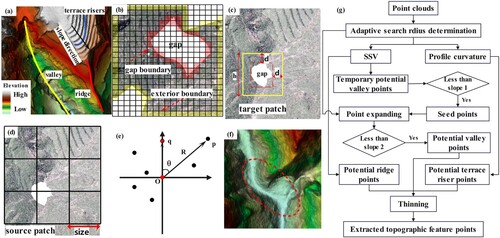
Figure 3. Topographic feature point interpolation and patch matching processes. (a) A similar region for a gap. (b), (c), (d) and (e) The rules to determine if two point sets match. (f) Flowchart for the topographic feature recovery process.
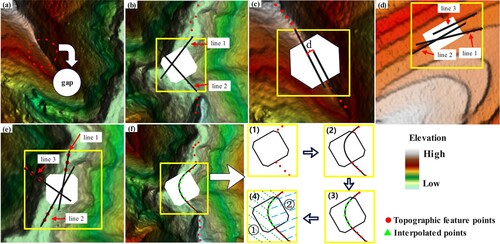
Figure 4. Information for the test areas. (a), (d), (g) and (j) are point clouds. (b) and (c) are point clouds with gaps created by digging. (c) and (f) are rendered maps. (h) and (k) are partial 3D visualisations of Area 3 and Area 4, respectively. (i) and (l) are real terrain gaps caused by filtering out vegetation.
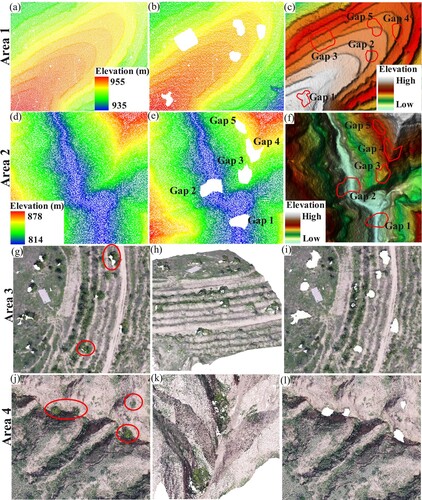
Figure 5. Gap boundary points and topographic feature points in Area 1 and Area 2. (a) and (b) Detected gap boundary points. (c) and (d) are the extracted and interpolated topographic feature points.
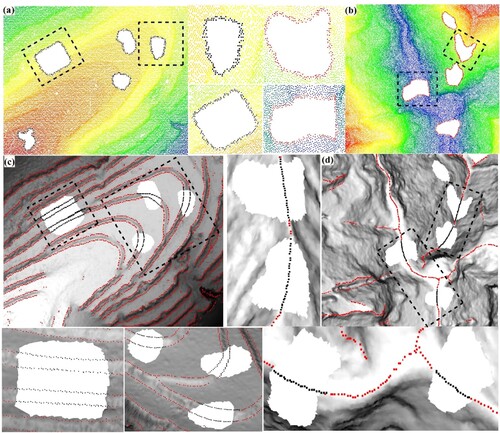
Figure 6. Gap restoration results in Area 1.
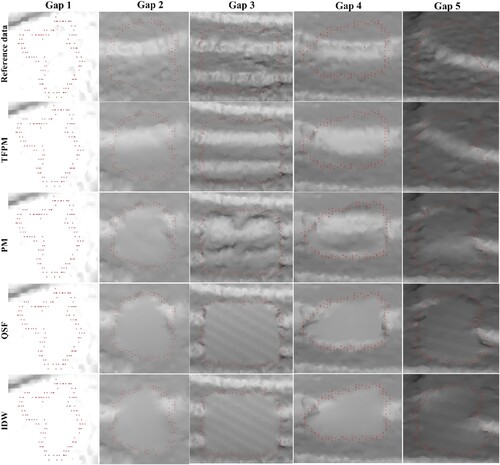
Figure 7. Gap restoration results in Area 2.
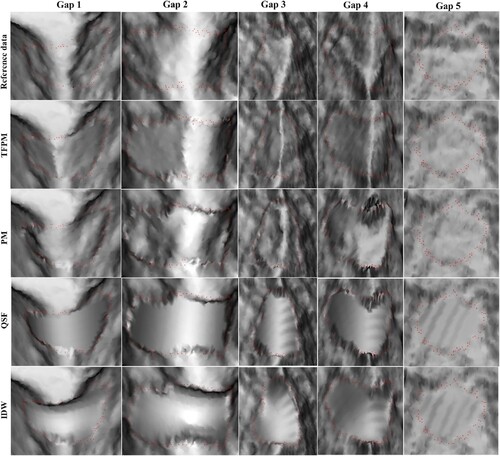
Figure 8. Accuracy verifications of the generated grid-DEMs in Area 1 and Area 2. (a) RMSE values of the generated grid-DEMs. (b) and (c) show the modelling error frequencies of the grid-DEMs.
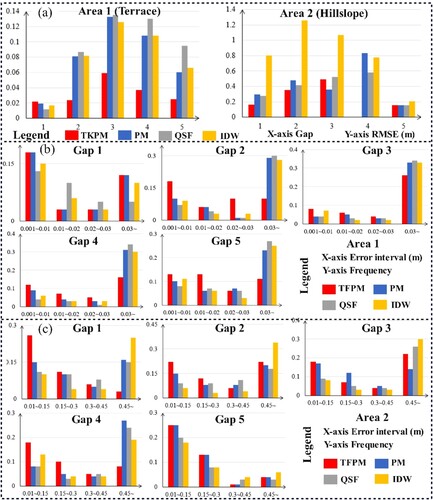
Figure 9. Average point elevation differences in Area 1 and Area 2.
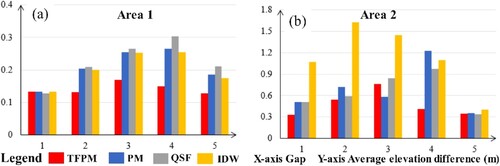
Figure 10. Average slope differences in Area 1 and Area 2.
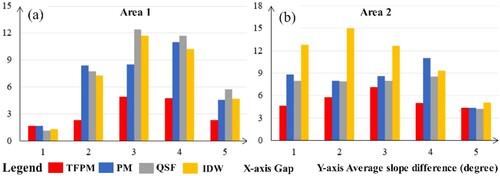
Figure 11. Re-extracted topographic features in Area 1 and Area 2 using the restored results obtained with different methods.
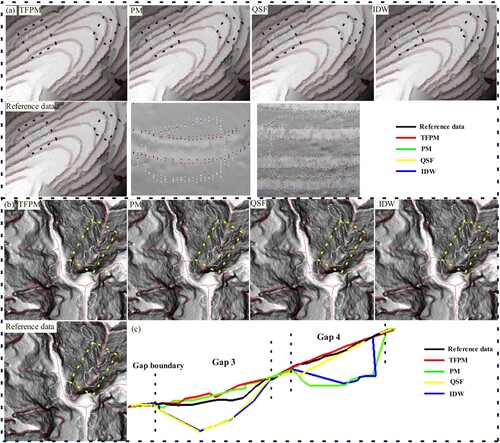
Figure 12. (a), (c) and (d) Gradient maps of restored terrain surfaces and their partial visualisations in Area 3 and Area 4. (b) Valley lines in Area 4 generated by the restored points of these methods.
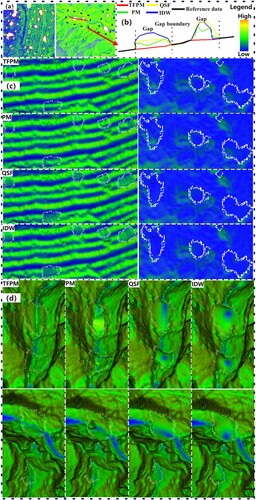
Figure 13. Comparisons of the restoration methods with and without topographic features based on visualisation of results, elevation distance and slope distance.
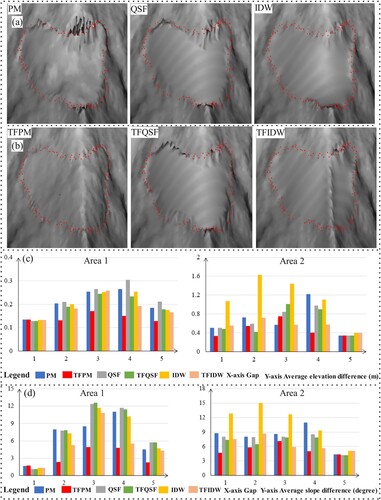
Figure 14. Detected gap boundary points obtained by multiple search radii, APDs, and test areas.
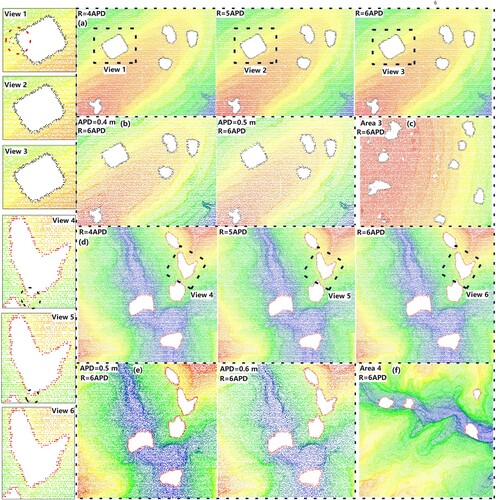
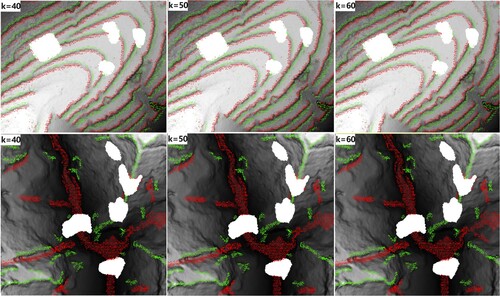
Figure 15. Extracted potential feature points under multiple k values.
Data availability statement
The test data that supports this work is available in ‘figshare’ repository with the private link ‘https://figshare.com/s/d1e7ccb5d56793ed5e89’.