
Figures & data
Figure 1. (A) The accumulated 13 million border markers and (B) the 2 million inaccurate border markers of the cadastral index map of Finland in a 10-km² grid. Pink areas have no inaccurate border markers, such as the capitol region.
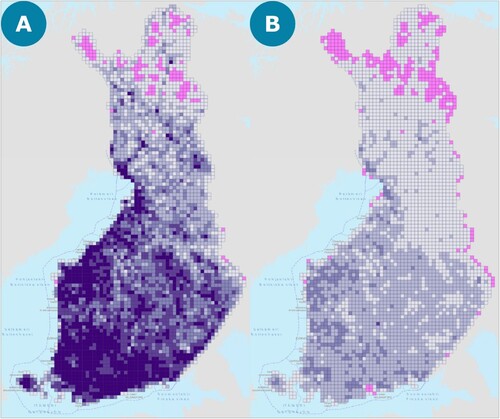
Figure 2. Root causes of why a significant portion of the quality and accuracy of border markers is insufficient.
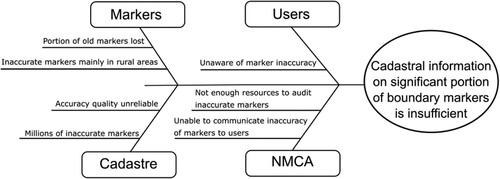
Figure 3. The crowdsourcing task performed by citizens described in the requirement phase of the artefact creation process.
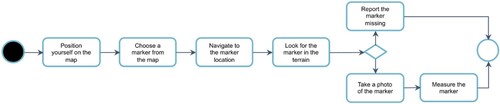
Figure 4. The artefact concept of a mobile application enabling crowdsourced refinement of border markers was depicted in the design phase.
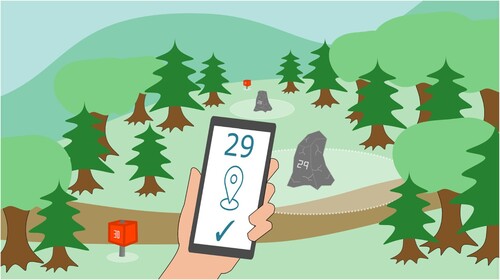
Table 1. The main design issues during the creation of the artefact, issue solutions, and solution rationales for the artefact sorted by their DSR phase of when the issue emerged.
Table 2. The artefact categorisation (Gómez-Barrón et al. Citation2016; Morschheuser et al. Citation2017a).
Figure 5. The map-based user interface of the artefact is simple. (A) The background map was customised for moving on foot in the terrain including cadastral border lines. The citizen layer consisted of unmeasured (green) and measured (orange) inaccurate border markers. (B) A measurement required a photo and the location measurement of the border marker. (C) Border markers measured by the citizen were displayed on the map with a special icon to follow one’s progression.
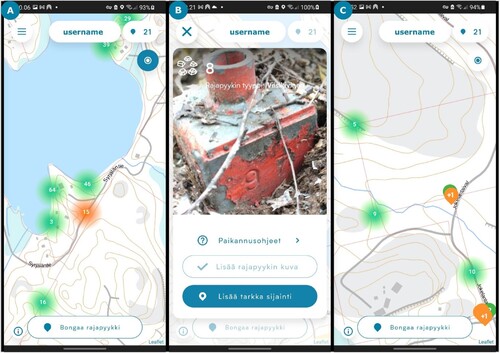
Figure 6. The artefact was demonstrated during the summer and autumn months with citizens.
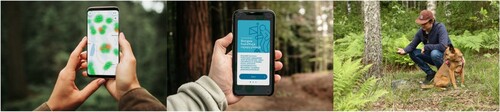
Figure 7. Heatmap of accumulated contributions over the pilot period from 1st of July to 28th of October. Each heatmap displays the situation on the first day of the month except for November where the last day of contributions was chosen to be 28th of October.
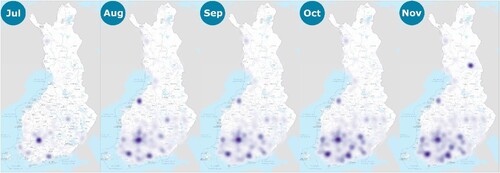
Figure 8. (A) The areas with contributions (purple), the areas without contributions (yellow), and empty areas where there are no inaccurate border markers (white) displayed on a 10-km² grid. (B) The accumulated contributions on the 10 km² grid show regional hotspots. (C) The region with the marketing campaign (South to -West) and the region with the self-organised mapping party (North to East)
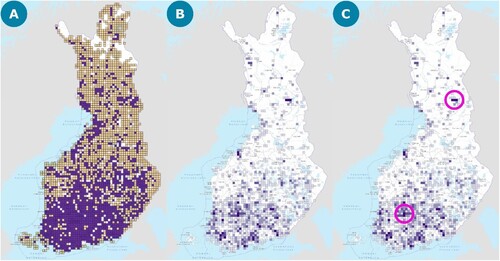
Figure 9. The number of contributions per day show a large spike at the start of the vacation period in July and some drop at the end of the vacation period in September. The contributions mean was 164, median 135 per day while the peak was 810.
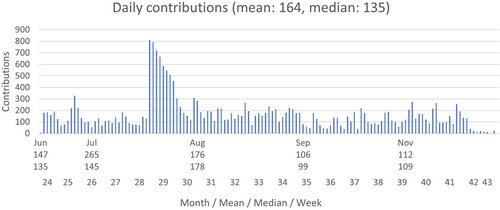
Figure 10. Chosen player types (multi-choice) in the questionnaire by citizens (n = 423).
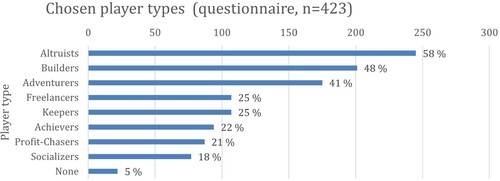
Figure 11. Border marker measurements (blue) and border markers reporting missing (orange) by player types selected by citizens. The citizen could select with multiple player types.
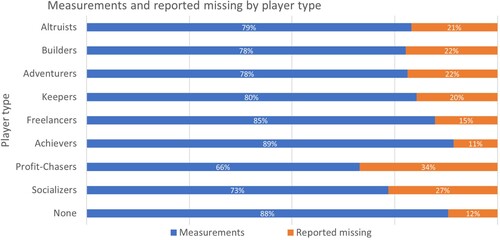
Figure 12. The average and median of contributions by player types show that the differences between player types were not statistically significant.
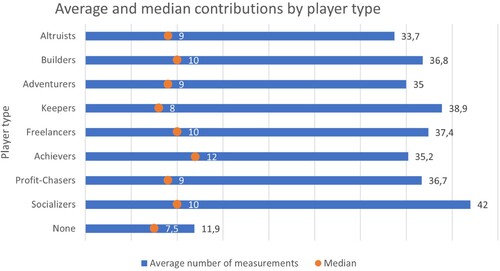
Figure 13. The top 10% of the player types have made more than half of the all the contributions of said player type.
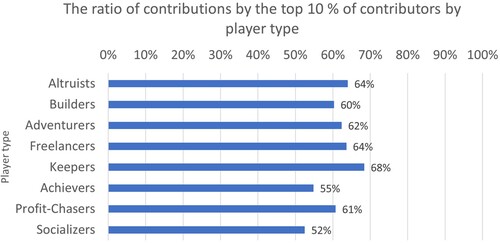
Figure 14. The utility of the artefact had mainly positive effects on respondent motivation. Faraway marker and nearby marker were added as control questions. Mean score of the utility is in parenthesis.
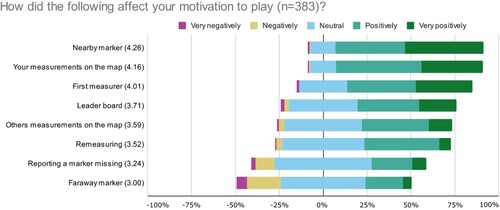
Figure 15. New gamification affordances added to the artefact would have positive effects on respondent motivation.
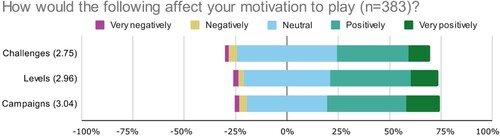
Figure 16. The artefact was considered easy to use both in the tasking and reporting phase by the respondents.
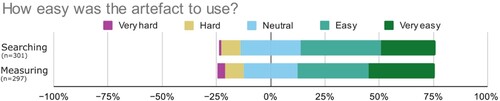
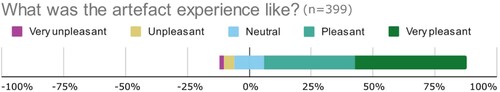
Figure 17. The questionnaire respondents found the experience of using the artefact pleasant.
Data availability statement
The data gathered in this study consisting of contributions and questionnaire responses by citizens who have given consent. The contributions contain both a unique identifier (an email address or username) and a geolocation (likely to reveal a movement pattern or approximate location of residence). The questionnaire contains unique identifiers that can be connected to the contributions. Therefore, the data in this study is not ethical to be shared as such.