
Figures & data
Figure 1. The conceptual structure of this review.
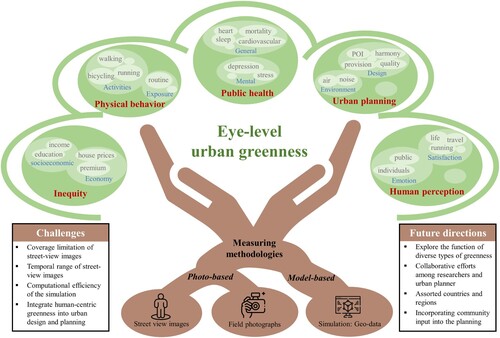
Figure 2. PRISMA flow diagram for selecting eligible studies, and means the number of papers The method is adapted from Moher et al. (Citation2009).
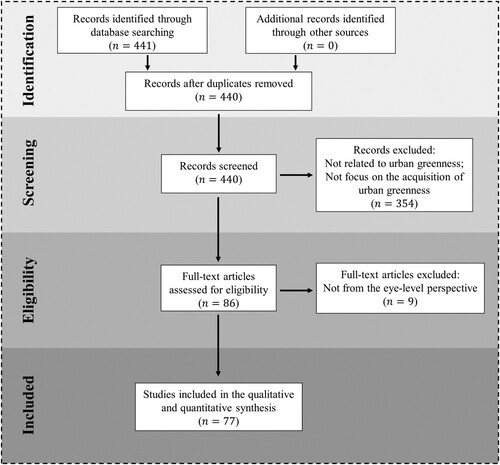
Table 1. Thematic clusters and subtopics categories.
Figure 3. Statistics of the eligible papers. (a) The number of papers published per year; (b) data sources used to measure eye-level urban greenness and their associated percentages; (c) study region involved and the number of studies in these countries; (d) domains defined based on the outcome of this study and their associated percentages.
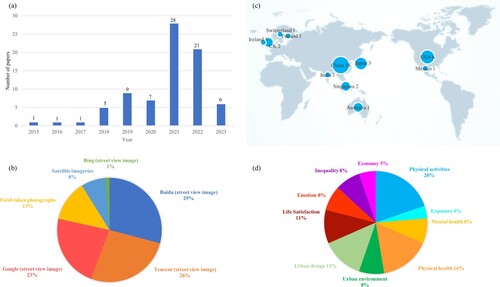
Table 2. A brief summary of the identified three primary measurements of eye-level urban greenness.