Figures & data
Figure 1. Location of the study area and the average number of good quality-observation Sentinel-2 images from 2017 to 2021.
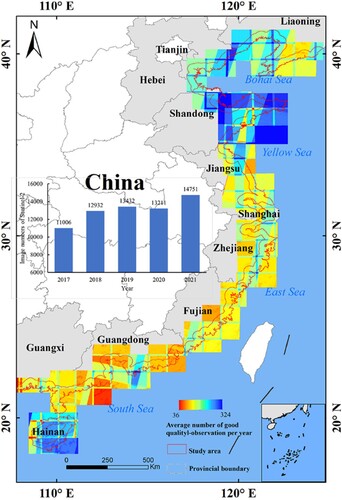
Table 1. Details of Sentinel-2A/2B satellites.
Figure 2. The distribution of sample points and sample polygons in this study.
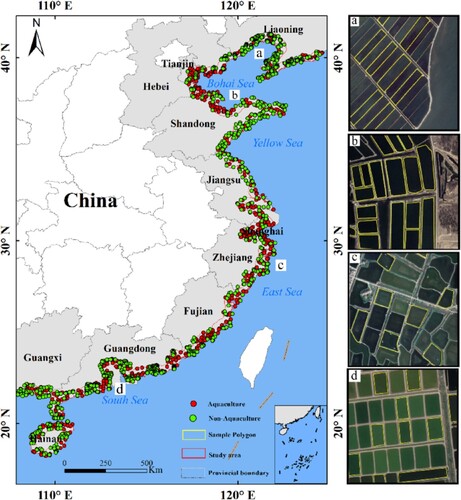
Table 2. The number of sample points in this study from 2017 to 2021.
Figure 3. Workflow of the study.
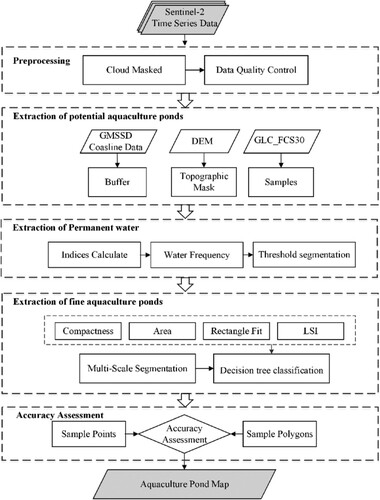
Figure 4. Elevation and slope histograms of aquaculture pond distribution based on samples.
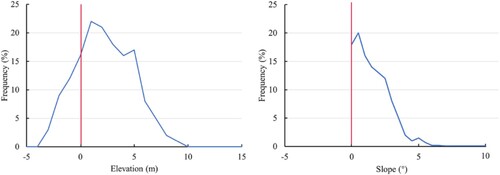
Figure 5. Differences in AWEInsh and AWEIsh indices of different feature types.
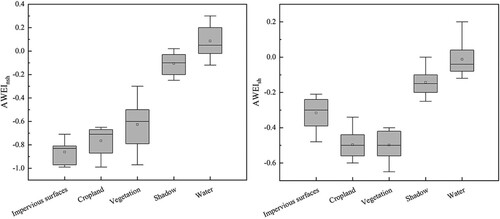
Table 3. Spectral indices used for the determination of water pixels.
Figure 6. Trend of the overall accuracy of permanent waterbodies with WF threshold.
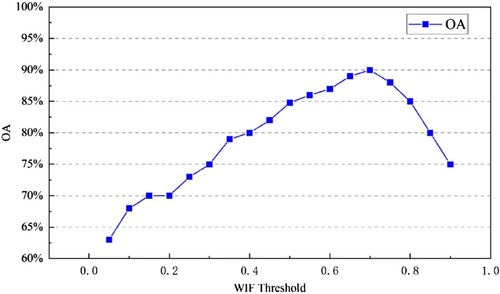
Figure 7. Optimal segmentation scale calculation result in Zhejiang Province.
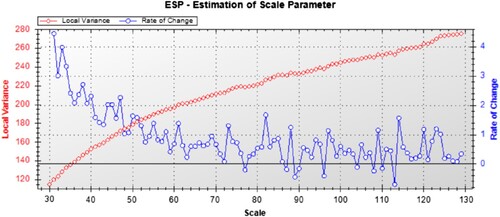
Figure 8. Segmentation results in three typical area. (A) Liaodong Bay, Liaoning Province; (B) Bohai Bay, Shandong Province; (C) Sanmen Bay, Zhejiang Province; (D) Jiao Bay, Guangdong Province.
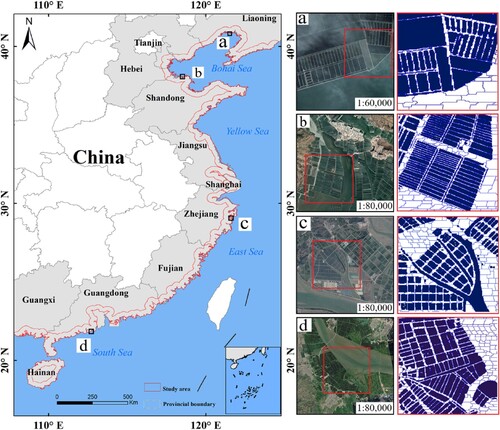
Table 4. Optimal segmentation scale for each province.
Table 5. The specific description and meaning of each classification feature.
Figure 9. Classification thresholds trained from polygon sample data. (OW: other waterbody types; AP: aquaculture ponds.) (a) Statistical results of the area; (b) Statistical results of LSI; (c) Statistical results of the compactness; (d) Statistical results of the rectangular fit.
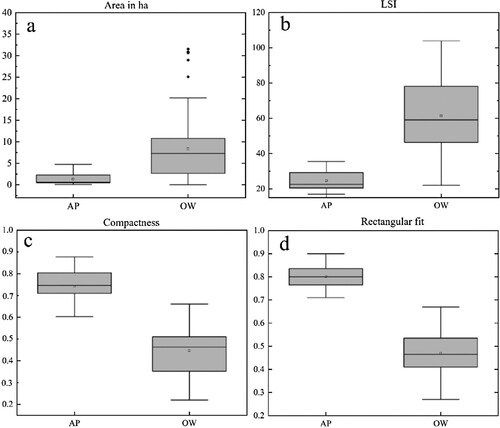
Figure 10. The spatial distribution of independent reservoirs and aquaculture ponds. (A) and (B): Independent reservoirs; (C): Aquaculture ponds.
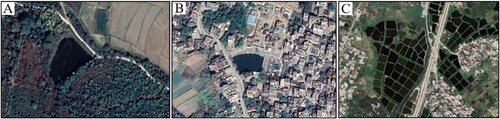
Table 6. Confusion matrix and F1 scores for the aquaculture pond map in China during 2017-2021.
Figure 11. Comparison of aquaculture ponds extracted with sample polygons obtained by automated extraction based on Google Earth. (a) Liaodong Bay, Liaoning Province; (b) Bohai Bay, Shandong Province; (c) Sanmen Bay, Zhejiang Province; (d) Jiao Bay, Guangdong Province.
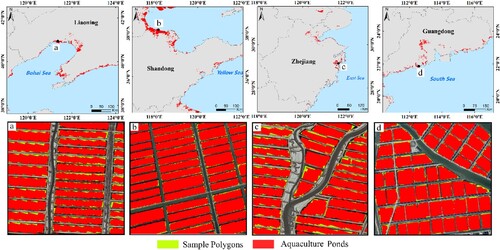
Table 7. Comparison of the aquaculture ponds area in typical areas.
Figure 12. The spatial distribution of China's coastal aquaculture ponds during 2017-2021. (A) Liaodong Bay, Liaoning Province; (B) Laizhou Bay, Shandong Province; (C) Yancheng City, Jiangsu Province; (D) Sanmen Bay, Zhejiang Province; (E) Changsha Bay, Guangdong Province; (F) Beihai Port, Guangxi Province.
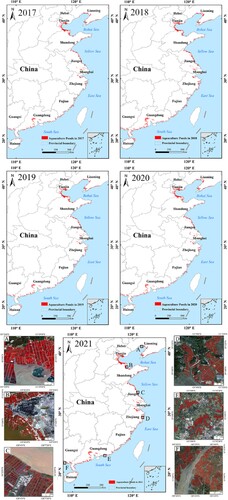
Figure 13. Kernel density analysis map of aquaculture ponds in 2021.
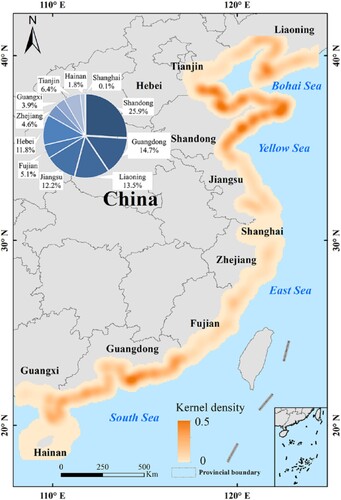
Figure 14. Aquaculture pond area changes in China's coastal zone from 2017 to 2021. (a) Aquaculture pond ACR in coastal provinces during 2017–2021. (b) Changes in the area of aquaculture ponds by province during 2017–2021. (c) National aquaculture pond total area changes during 2017–2021.
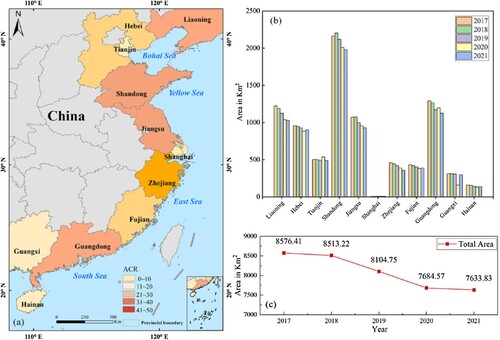
Figure 15. Spatial distribution of typical coastal aquaculture ponds in 2017 and 2021. (a) Liaodong Bay, Liaoning Province; (b) Bohai Bay, Shandong Province; (c) Sanmen Bay, Zhejiang Province; (d) Jiao Bay, Guangdong Province.
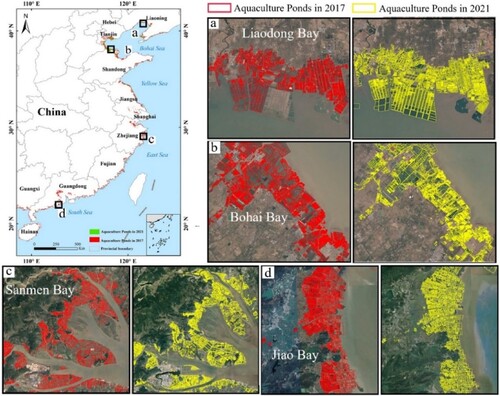
Figure 16. Percentage of aquaculture ponds converted into land cover types in China’s coastal provinces during 2017–2021.
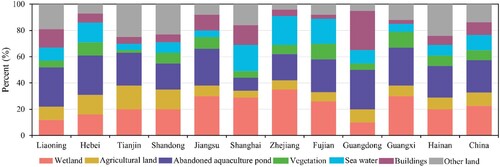
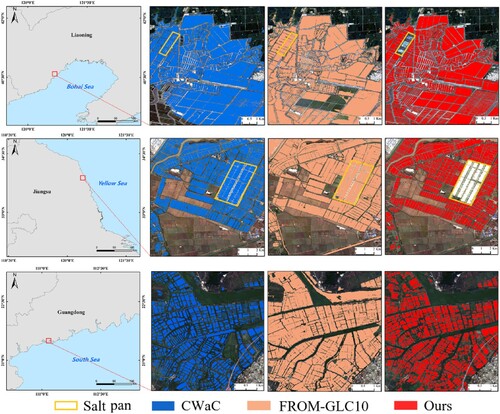
Figure 17. Comparison of aquaculture ponds extracted results with other 10-m resolution datasets.