Figures & data
Figure 1. The spectral reflectance curves of different earth’s surfaces.
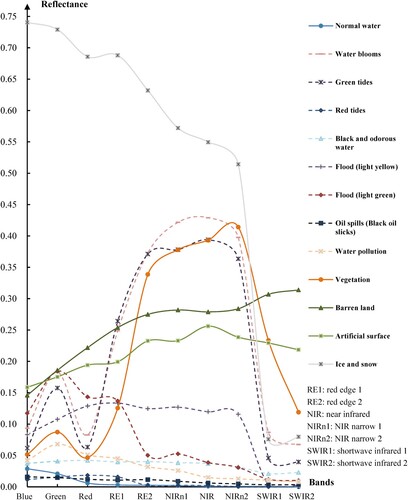
Table 1. The acquisition time and location information of the selected Sentinel-2 data.
Figure 2. The natural color images, grayscale images of remote sensing indices, and detection results of water quality anomalies. White represents the water quality anomalies, and black represents the non-water quality anomalies in the detection results.
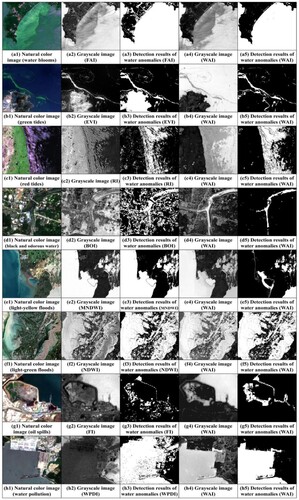
Table 2. The precision, recall, and F1-scores of different water quality anomaly detection results.
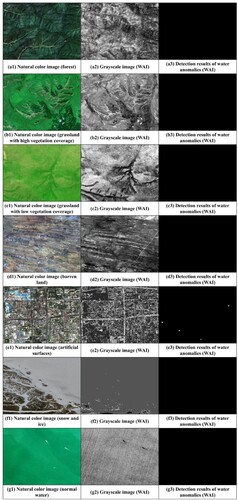
Figure 4. The natural color images, grayscale images of the WAI, and detection results of water quality anomalies. White represents the water quality anomalies, and black represents the non-water quality anomalies in the detection results.