
Figures & data
Figure 1. Illustration of the workflow for the proposed model. The pre-segmentation phase integrates the ImSE-Net model with SLICm superpixel optimization, generating a preliminary semantic segmentation result denoted by the red dashed line above. The UGLS algorithm for further refinement classification results is indicated by the lower green dashed frame. (a) Original image; (b) segmentation result using ImSE-Net; (c) contour refinement based on SLICm; (d) segmentation result combining ImSE-Net and SLICm; (e) final segmentation result.
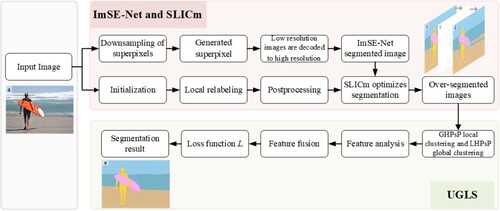
Figure 2. Illustration of the workflow for the proposed ImSE-Net method. FCN-32 uses ResNet-101 as the backbone, in combination with the proposed ImSE-Net model from Conv2_x to Conv5_x. This method groups pixels from the downsampling layer to create a allocation matrix assigning predicted target values to each pixel group. Unlike existing neural network methods, this method does not explicitly employ superpixel segmentation for downsampling. Hence, the method can be integrated into existing architectures without altering their feedforward paths.
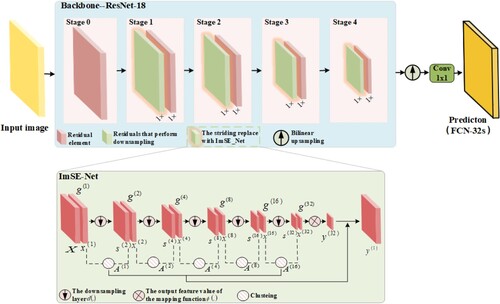
Table 1. Detailed process for the ImSE-Net.
Table 2. Detailed process for superpixel refinement.
Figure 3. Illustration of the global hidden pseudo-positives and local hidden pseudo-positive selection process. GHPsp: unlabeled image samples ; feature extractor F; task-agnostic reference pool
; anchor features
; the segmentation head S produces corresponding segmentation features
; an index set of
for each i-th anchor feature
; the momentum segmentation head
produces corresponding segmentation features
; task-specific reference pool
; an index set of
by comparing
and
; the projection head Z produces a projection anchor vector
; GHPsP contrastive loss for i-th patch in unsupervised semantic segmentation with multiple positives
and
; LHPsp: an index set
that contains the i-th anchor and its neighboring patches; it uses the average attention score value of
as the threshold for selecting LHPsP
among
and then takes the above-average portion as the final experiment selection; the calculated gradient (G) for mixed feature
combines the neighboring positive features
with the corresponding attention scores
proportionally; the LHPsP objective functions
produces a projected mixed vector
; the global cost is Lc, and the local loss is Lr.
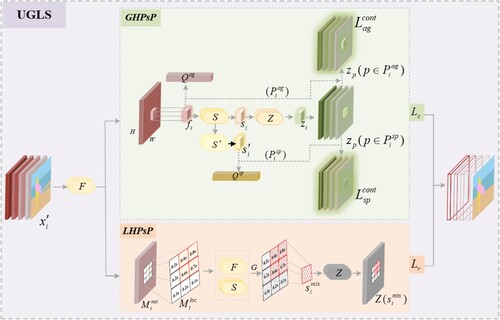
Table 3. Detailed process for unsupervised semantic segmentation UGLS.
Table 4. Grouping information about datasets.
Table 5. Test set task categories.
Table 6. Quantitative evaluation indicators.
Table 7. Description of the unsupervised semantic segmentation algorithms.
Figure 4. Example results with the COCO-stuff test set.
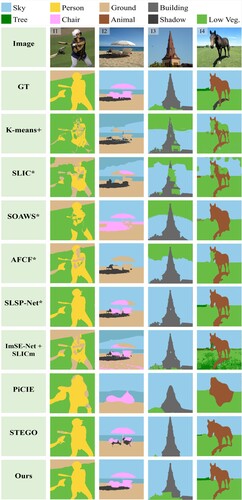
Figure 5. Example results on the build test set.
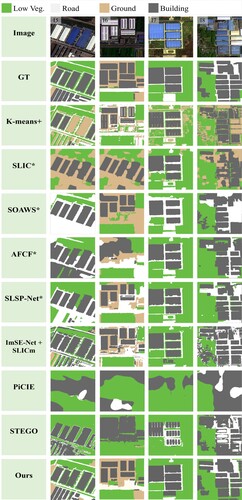
Figure 6. Example results on the mixed region test set.
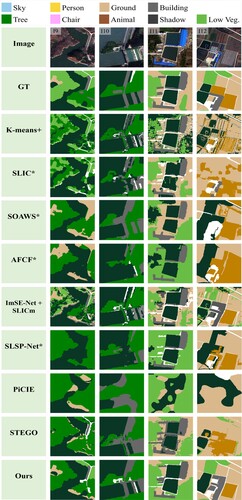
Table 8. Per-class result on the COCO-stuff test set.
Table 9. Evaluation scores (%) of different baseline methods based on the COCO-stuff test set.
Table 10. Comparison between baseline and state-of-the-art methods for experiment 2. The best values are highlighted in bold.
Table 11. Per-class result for experiment 3.
Table 12. Comparison between baseline and state-of-the-art methods for experiment 3.
Table 13. Experimental results with various backbone network combinations.
Table 14. Evaluation results of the hierarchical levels.
Table 15. Influence of main components on semantic segmentation results.
Table 16. Influence of different stages on semantic segmentation results.
Data availability statement
The code used in this study are available by contacting the corresponding author.