
Figures & data
Figure 1. Validation areas for the elevation control points. (a) The geolocation (red points) of nine validation areas within the global land areas. (b) – (j) The distributions of the high-resolution DEMs (white line areas) and the elevation control points (blue points) within each validation area. I-X indicate the number of the study areas.
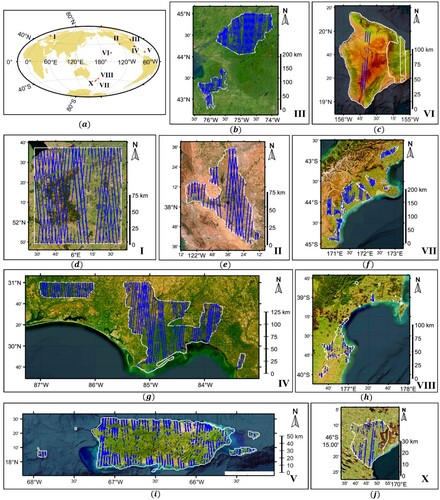
Table 1. The Characteristics of the DEMs.
Figure 2. Schematic diagram for the construction of the dataset.
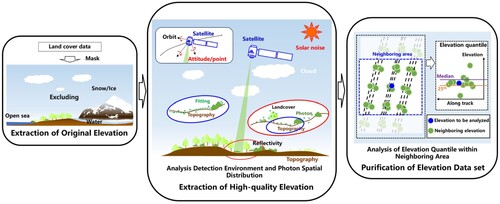
Table 2. Data Dictionary of the Dataset.
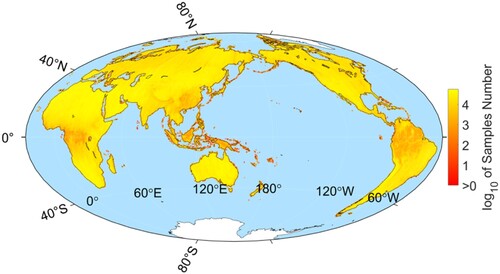
Figure 3. Distribution of elevation control points in the dataset
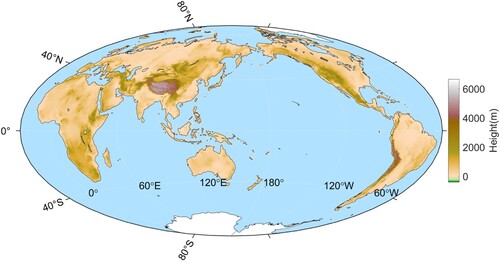
Table 3. Accuracy Analysis of the Elevation Control Points Within Each Validation Region.
Figure 4. Histogram statistics for the elevation control points within the validation areas. (a) – (c) Statistics of the elevation control points with levels 1 - 3, corresponding to flat, hilly and mountainous areas along track, respectively.
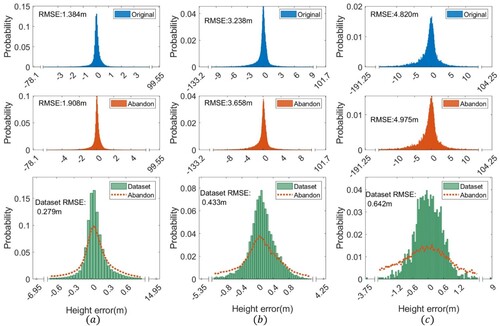
Table 4. Accuracy Comparison of the Strong and Weak Beams’ Elevation Control Points.
Table 5. Accuracy Comparison of the Elevation Control Points Within Urban and Non-Urban Areas.
Figure 5. Distribution of the dataset within the different vegetation cover indices.
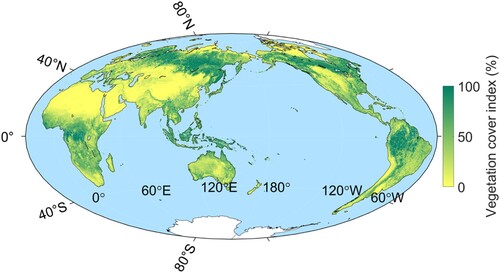
Figure 6. Proportions of the dataset within the different vegetation cover indices.
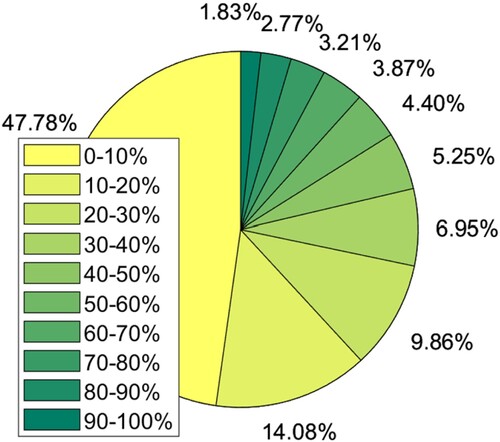
Figure 7. Accuracy analysis of the elevation control points within the different vegetation cover indices. (a) – (c) The sample number, RMSE, and elevation error of the original elevations and the dataset elevations, respectively.
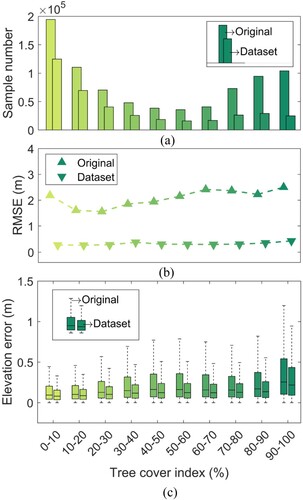
Figure 8. Statistics for the elevation control points within the global 0.25°×0.25° grid.
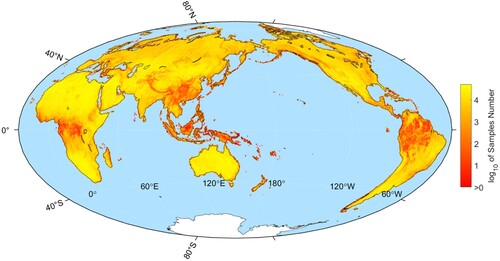
Figure 9. Statistics for the original elevation points within the global 0.25°×0.25° grid.
Data availability statement
The data that support the findings of this study are openly available in National Tibetan Plateau / Third Pole Environment Data Center at https://doi.org/10.11888/Terre.tpdc.300508
(Xie et al. Citation2023).