
Figures & data
Figure 1. GGW-BDF home page. GGW-BDF, Great Green Wall Big Data Facilitator.
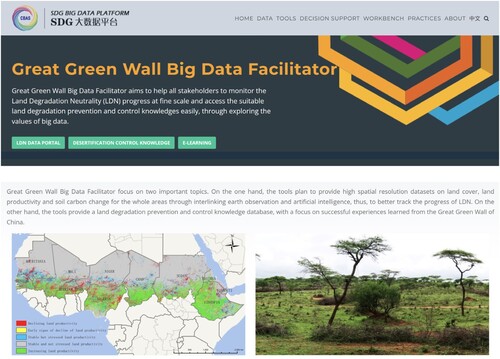
Figure 2. Synthetic workflow of the basic structure of the GGW-BDF: functions and technological components. GGW-BDF, Great Green Wall Big Data Facilitator.
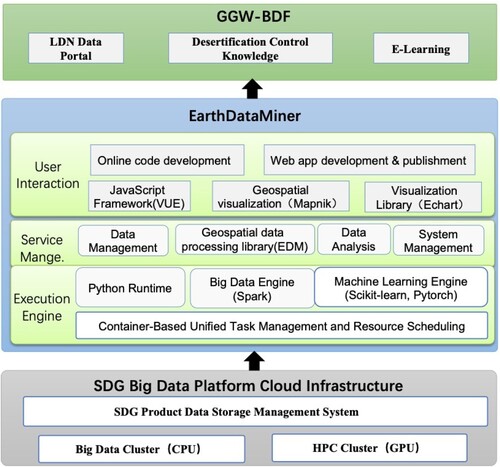
Figure 3. GGW countries and Sahel regions. Data source: https://zenodo.org/records/8239305. Data were reclassified. GGW, Great Green Wall.
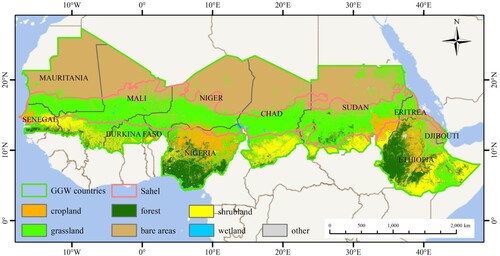
Figure 4. Flowchart of the generation of Land Degradation Neutrality.
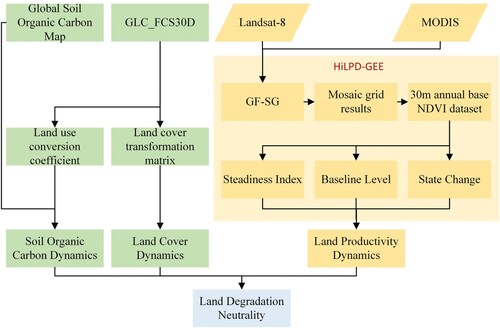
Table 1. Radiometric calibration parameters for the SDGSAT-1 TIS.
Figure 5. GGW-BDF LDN Data Portal. GGW-BDF, Great Green Wall Big Data Facilitator; LDN, Land Degradation Neutrality.
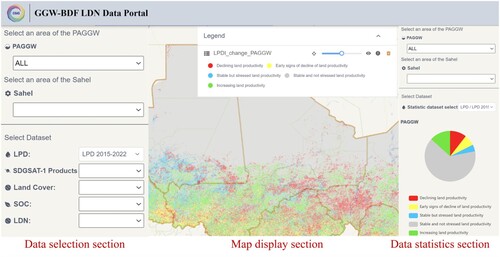
Figure 6. Distribution of (a) land productivity dynamics, (b) land cover change, (c) soil organic carbon change, and (d) land degradation neutrality in African Great Green Wall.
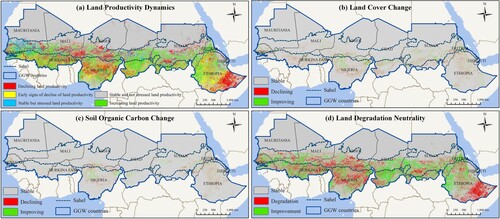
Figure 7. Dominant factor of land productivity dynamics change from 2015 to 2022.
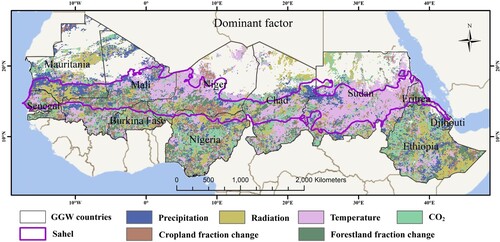
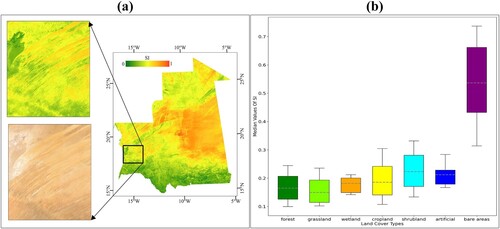
Figure 8. (a) Normalized median composite silica index in Mauritania from 2022 to 2023 and (b) its statistical values under different land cover.
Supplemental Material
Download MS Word (971.1 KB)Data availability statement
The data supporting the findings of this study are available from the corresponding author, Tong Shen, upon reasonable request.