
Figures & data
Table 1. Comparison of different GDCs and the proposed RTGDC.
Figure 1. The paradigm shift between GDC and RTGDC.
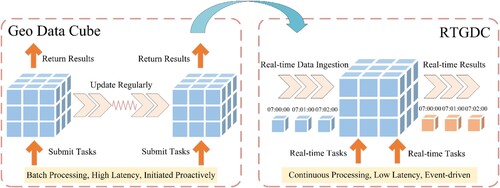
Figure 2. The conceptual model of the RTGDC.
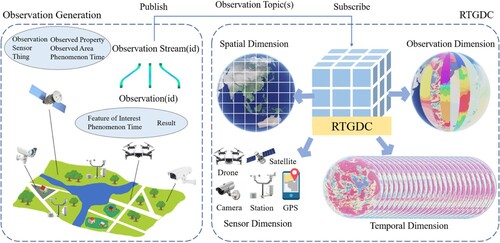
Figure 3. The logical model of the RTGDC.
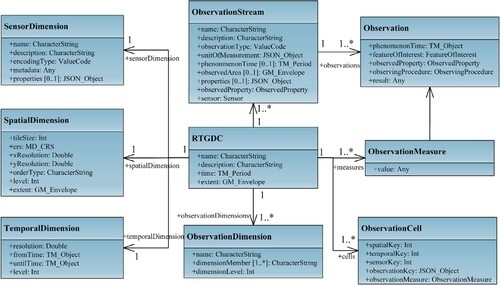
Figure 4. Data delivery workflow coupling of OGC Pub/Sub interface Standard and OGC SensorThings API.
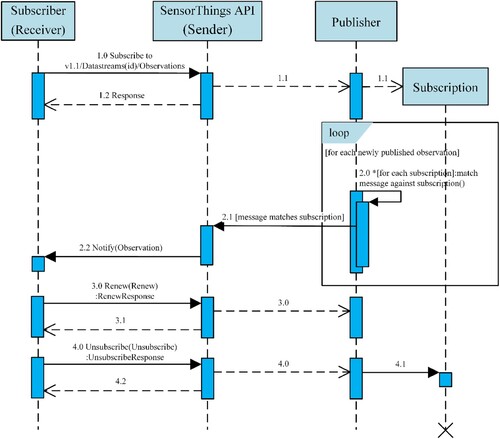
Figure 5. Workflow diagram for RTGDC analysis and computation.
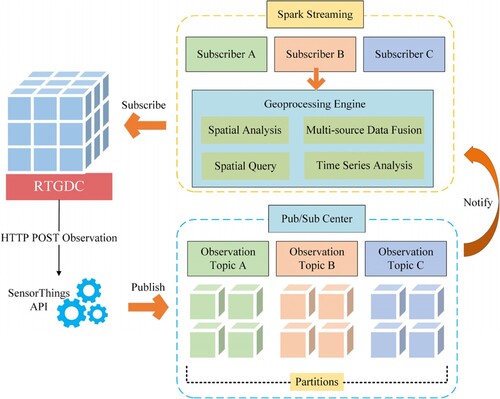
Figure 6. Underlying logic of the Spark Streaming framework.
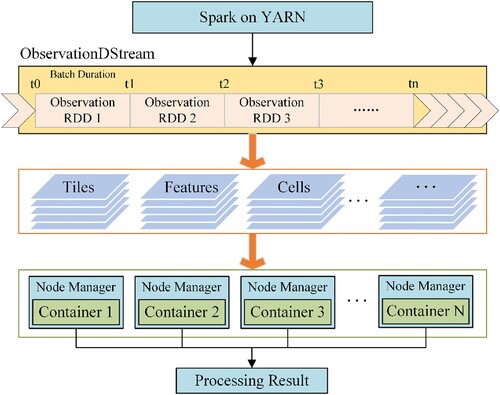
Figure 7. The UML diagram of the RTGDC computation entities.
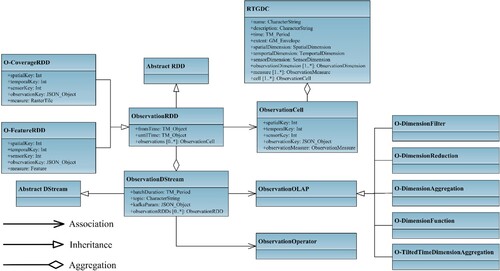
Figure 8. Overall architecture of the RTGDC system.
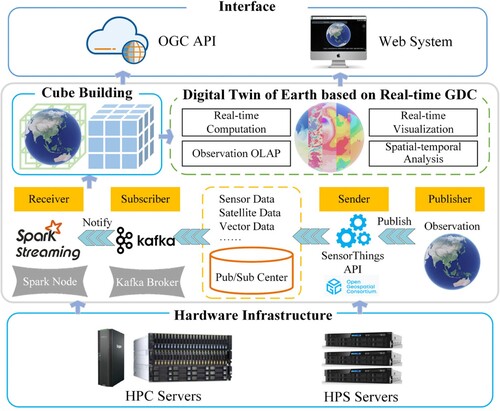
Table 2. All data used in the case
Figure 9. An example modeling for publishing station observations in SensorThings API.
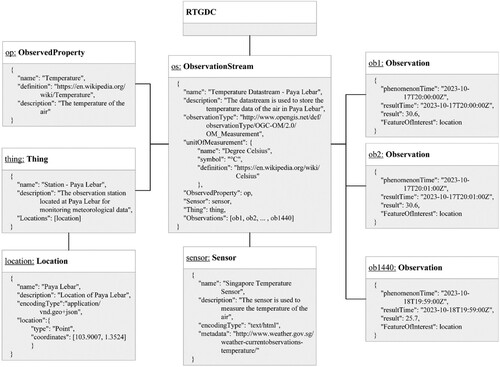
Figure 10. The analysis results of real-time station data ingestion: (a) latency; (b) throughput; (c) parallel efficiency.
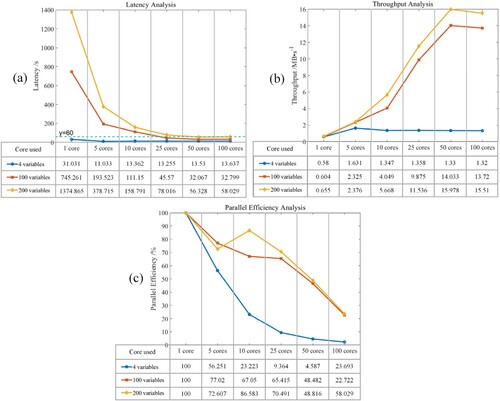
Figure 11. Cumulative visualization of real-time meteorological data in Singapore over 24 h: (a) temperature; (b) relative humidity; (c) precipitation; (d) wind speed.
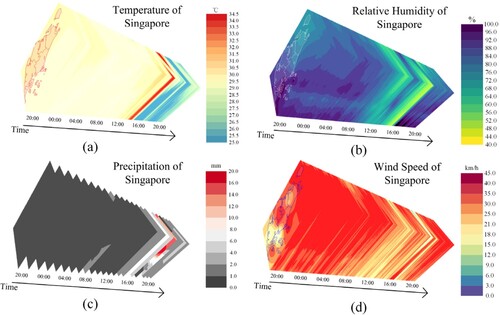
Figure 12. Minute-by-minute temperature changes throughout the day in 5 districts of Singapore: (a) line chart; (b) system visualization.
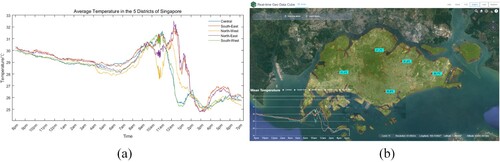
Figure 13. The calculation time for regional statistical analysis using RTGDC and GeoTIFF.
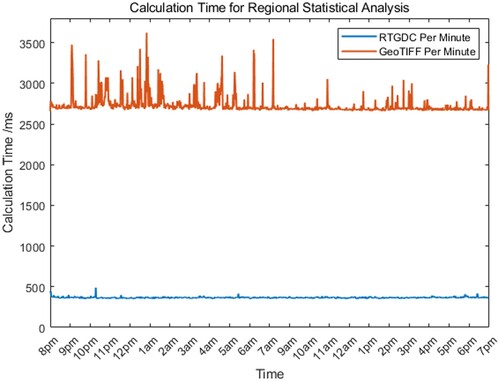
Figure 14. An example modeling for publishing raster data in SensorThings API.
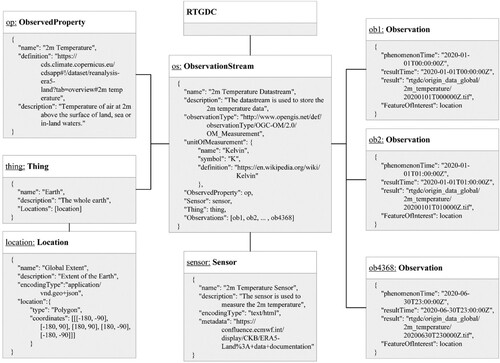
Figure 15. The analysis results of real-time raster data ingestion: (a) latency; (b) throughput; (c) parallel efficiency.
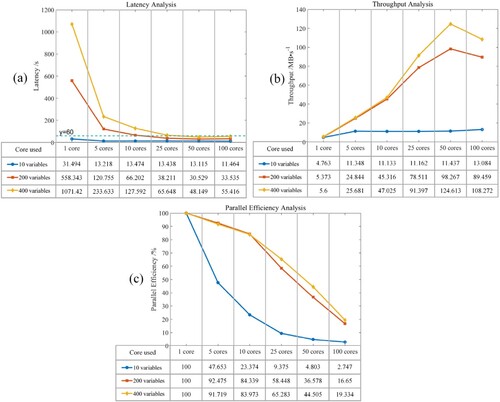
Figure 16. Temporal evolution of various meteorological variables using the RTGDC: 2 m temperature, surface sensible heat flux, surface pressure, low vegetation leaf area index, total evaporation, surface runoff, surface net solar radiation, high vegetation leaf area index and total precipitation (from left to right, top to bottom): (a) hourly data; (b) monthly data; (c) half yearly data.
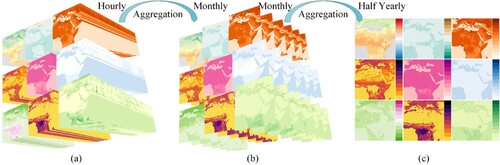
Figure 17. Temporal evolution of calculated meteorological variables using RTGDC.
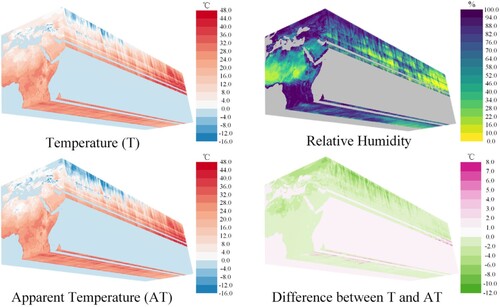
Figure 18. The calculation time for real-time climate analysis using RTGDC and GeoTIFF.
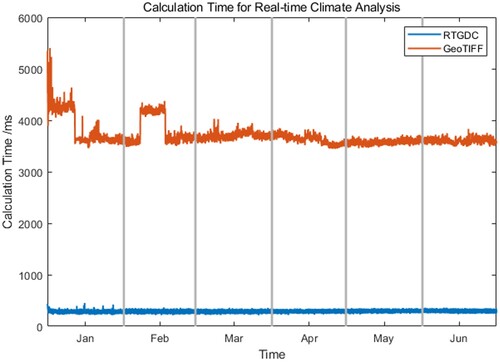
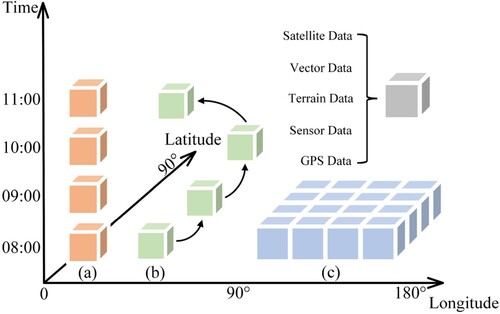
Figure 19. Cell-based spatiotemporal analysis for the digital twin of Earth: (a) temporal dimension analysis; (b) observation dimension analysis; (c) spatial dimension analysis.
Data availability statement
The data and codes that support the findings of this study are available in https://doi.org/ 10.6084/m9.figshare.25688610
. Furthermore, the real-time data (see http://www.weather.gov.sg/) of the use case ‘Digital Twin of Singapore' is available online. The ERA5-Land hourly data from 1950 to present (see https://doi.org/ 10.24381/cds.e2161bac ) of the use case ‘Global-scale Climate Analysis’ is available online.