
Figures & data
Figure 1. Map of land cover classifications in Henan province and distribution of 30 in situ stations. SM observation sites are marked with black dotted symbols. The bottom map is obtained based on MCD12Q1.
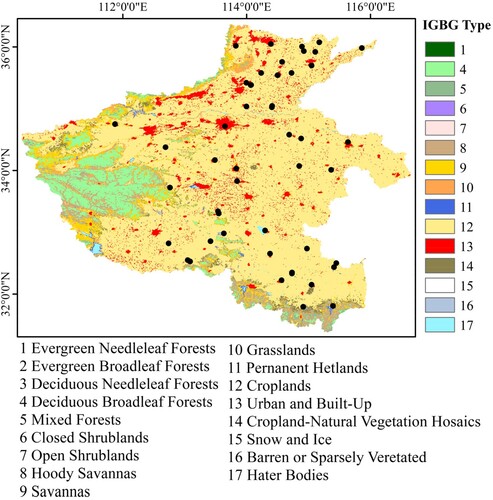
Table 1. Predictor compositions for the downscaling model.
Figure 2. Flowchart of the SM downscaling method.
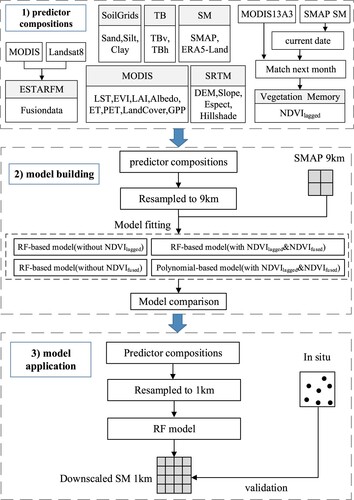
Figure 3. Comparison of downscaled SM against SMAP SM for different models. (a) the RF-based model (with NDVIlagged&NDVIfused), (b) the RF-based model (without NDVIlagged), (c) the RF-based model (without NDVIfused), (d) the polynomial-based model (with NDVIlagged&NDVIfused).
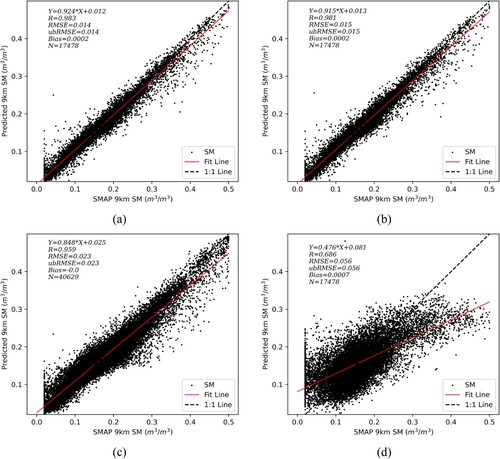
Figure 4. Feature importance scores for the downscaling method.
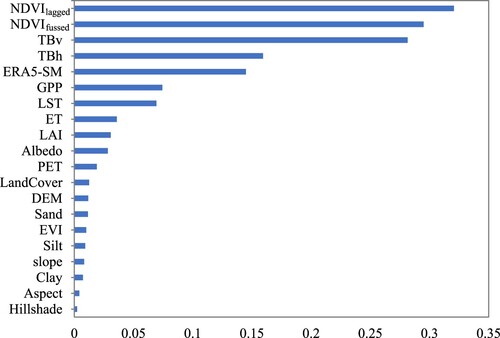
Figure 5. Scatter plots of the original SMAP SM against the in situ SM and downscaled SM of the RF-based model (with NDVIlagged&NDVIfused) against the in situ SM at different stations.
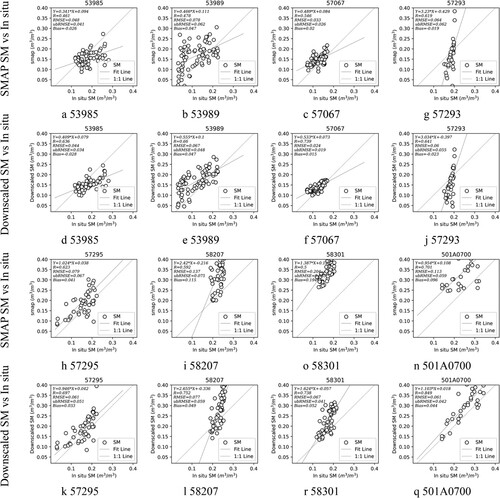
Table 2. Detailed statistical metrics for the downscaled SM of the RF-based model (with NDVIlagged&NDVIfused) at 30 sites.
Figure 6. Spatial comparisons of the original SMAP SM and downscaled SM
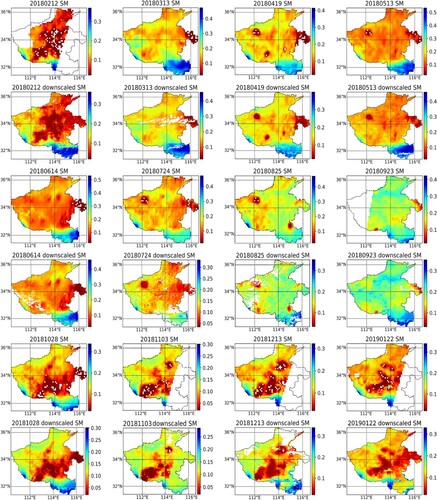
Figure 7. Temporal variations of original SMAP SM, downscaled SM, in situ SM measurements, and daily precipitation during February 2018 – February 2019 at four selected stations
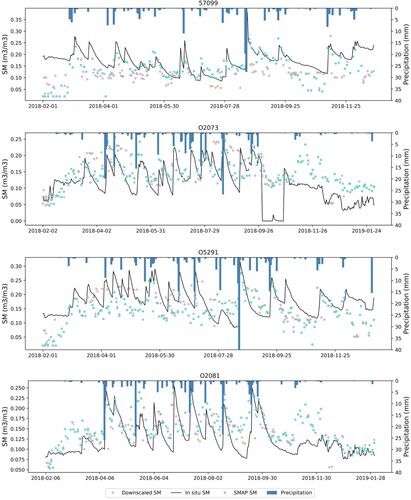
Table 3. Statistical metrics of the downscaled SM without NDVIlagged at 30 sites.
Table 4. Statistical metrics of the downscaled SM without NDVIfused at 30 sites.
Data availability statement
The data that support the findings of this study are available from the corresponding author upon reasonable request.