
Figures & data
Figure 1. Location of the study area. (a) Geographical location, (b) remote sensing image, and (c) ephemeral gully samples in the Zhoutungou watershed on the Loess Plateau.
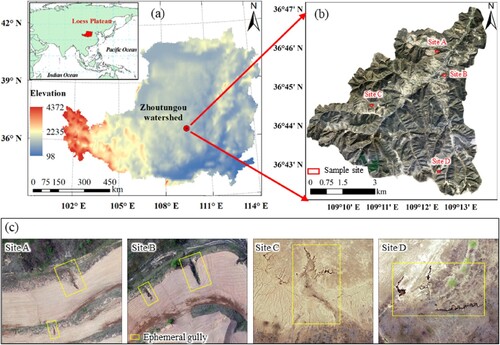
Figure 2. Monthly cumulative precipitation (orange bars) and average temperature (red curves) from 2009 to 2021 in the Zhoutungou watershed.
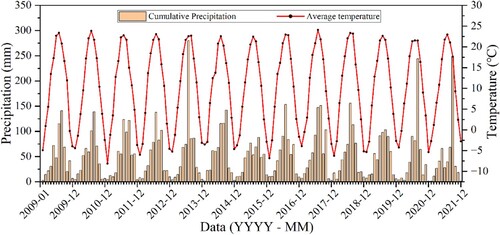
Figure 3. Flowchart of the methodology used in this study.
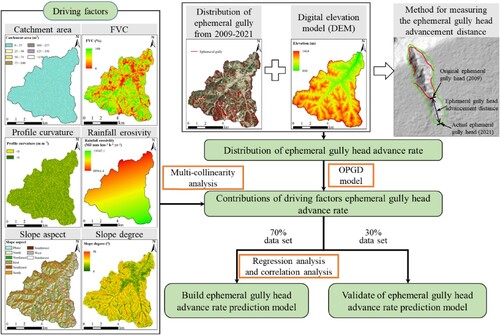
Figure 4. Spatial discretization parameter optimization for each continuous variable.
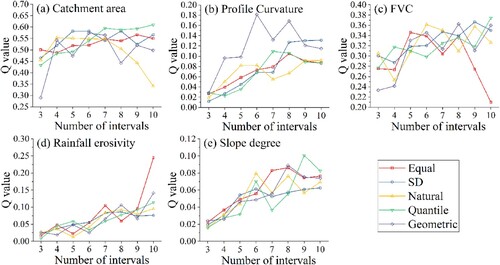
Figure 5. (a) Spatial distribution and (b) the relative frequency of ephemeral gully head advance rates from 2009 to 2021.
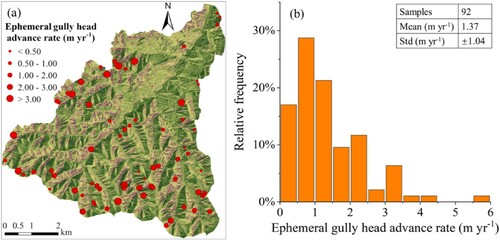
Figure 6. Ephemeral gully head advancement from 2009–2021 at two ephemeral gully sites: (a) ephemeral gully 68 and (b) ephemeral gully 85.
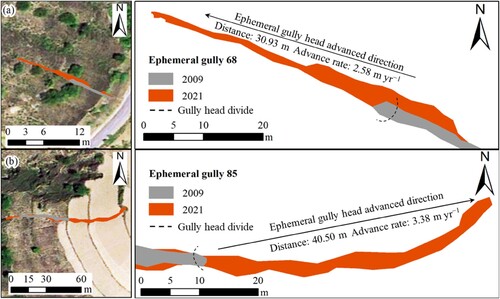
Table 1. Multi-collinearity testing indices for the independent variables in the study area.
Table 2. Ephemeral gully head advance rates in other global sites.
Figure 7. OPGD-based explanatory variable exploration of ephemeral gully head advance rate: (a) factor detector, (b) interaction detector, (c) ecological detector, and (d) risk detector.
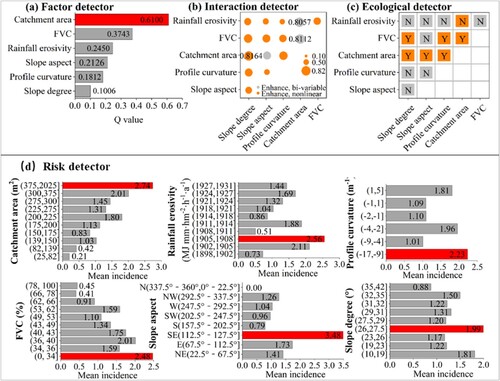
Figure 8. Regression function fitting curves for ephemeral gully head advance rate and (a) catchment area, (b) FVC, (c) rainfall erovisity, and (d) slope degree.
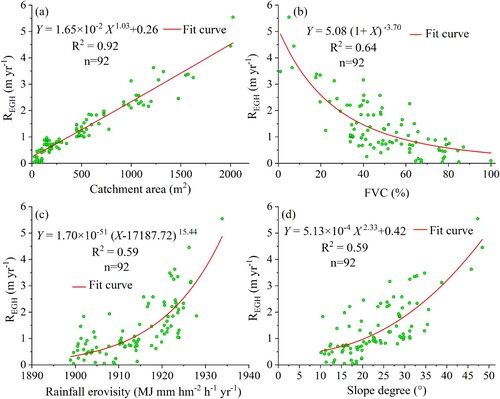
Figure 9. Ephemeral gully head advance rates from the field survey (measured values) and the prediction model (predicted values).
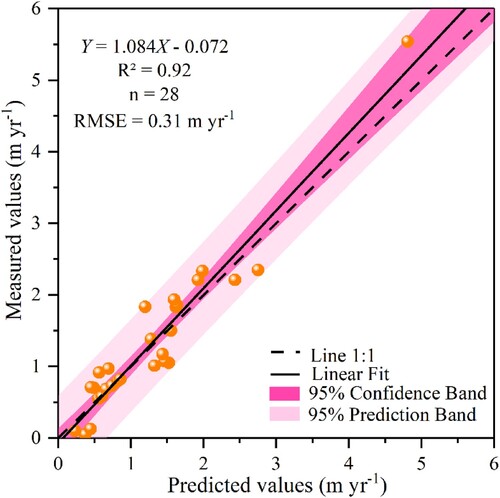
Table 3. Summary of global prediction models for ephemeral gully head advance rate