
Figures & data
Figure 1. Location Map of Banliang Village.
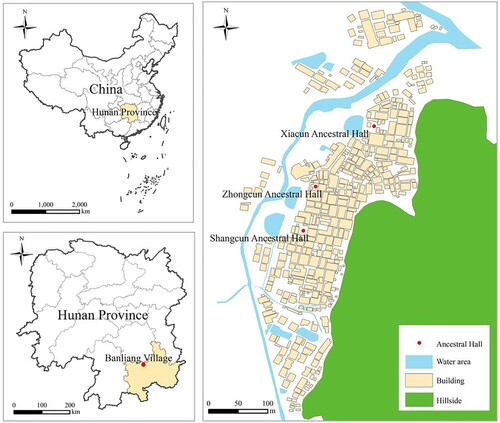
Figure 2. Satellite Image of Banliang Village (Caption: This satellite image of Banliang Village is provided by the Centre National d'Études Spatiales (CNES) and Airbus Group (Airbus). The image was captured on December 31, 2020. For presentation purposes, the image has been cropped and compressed).
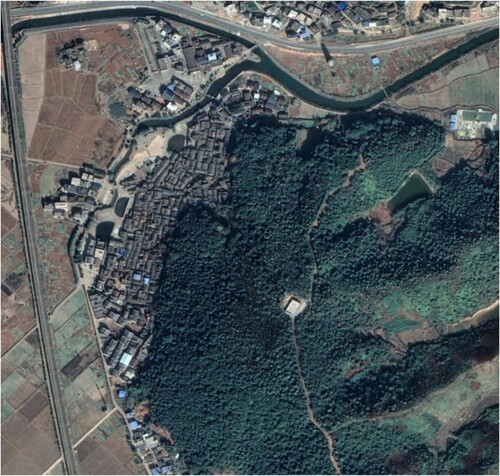
Figure 3. Schematic Diagram of the Relationship between Spatial Form and Spatial Order in Traditional Villages.
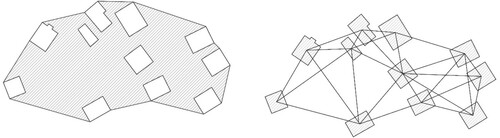
Figure 4. Key Architectural Era Assessment Chart.
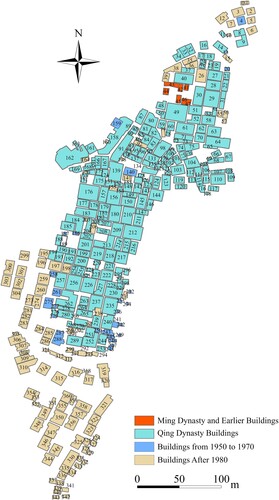
Table 1. Ranking of Building Node Centrality (Top 10% of Building Nodes by Each Centrality Metric).
Figure 5. Self-Network Graph of Nodes 96 (a) and 251 (b) in the Building Network Based on Weighted Degree Centrality.
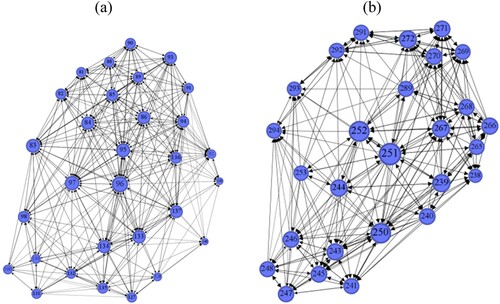
Table 2. A Comparison of Connection Count and Average Self-Orientation Similarity Weight for Nodes 96 and 251 in the Building Network.
Figure 6. Self-network Comparison Graphs for Building Nodes 85 and 154 Based on Eeighted Degree Centrality (a, b) and Weighted Eigenvector Centrality (c, d).
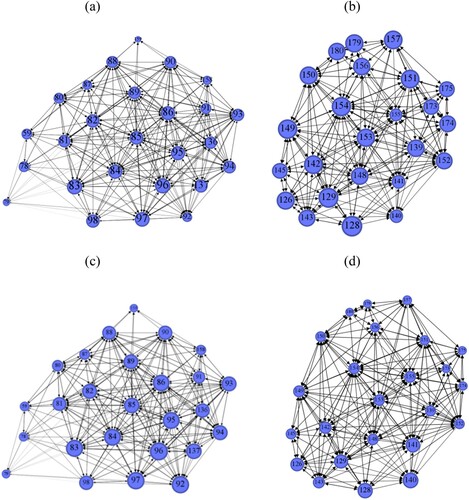
Figure 7. Spatial Distribution of High Centrality Building Nodes (Top 10%).
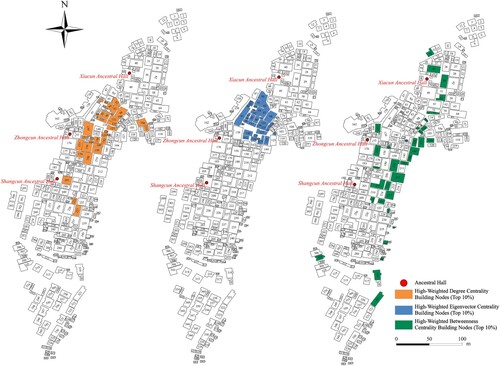
Table 3. Building Node Community Size, Proportion of Historic Buildings, and Average Directional Similarity.
Figure 8. Spatial Location Map of Building Node Communities (a) and Building Node Community Network Graph Based on Weighted Degree Centrality (b).
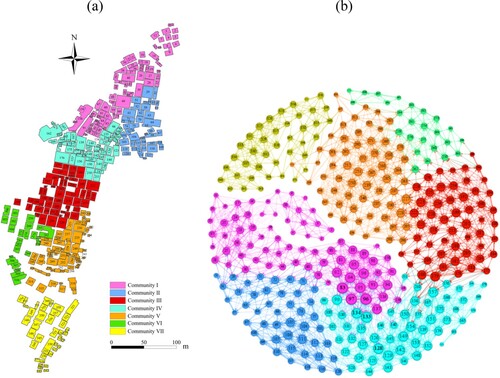
Figure 9. Spatial Location Map of Building Node Communities (a) and Building Node Community Network Graph Based on Weighted Eigenvector Centrality (b).
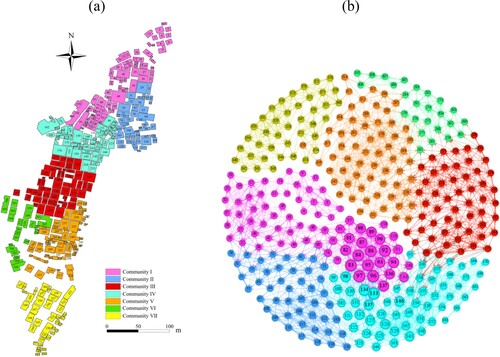
Figure 10. Spatial Location Map of Building Node Communities (a) and Building Node Community Network Graph Based on Weighted Betweenness Centrality (b).
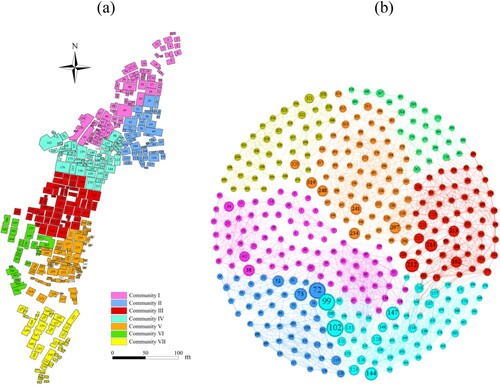
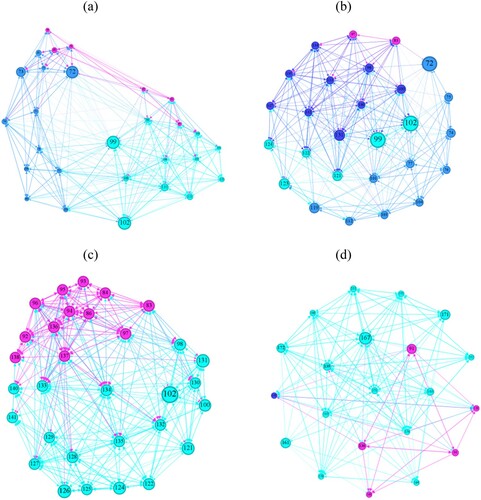
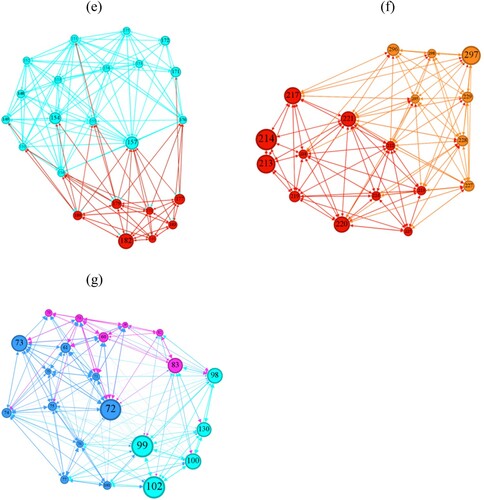
Table 4. Number and Proportion of Nodes with High Weighted Betweenness Centrality within Communities.
Data availability statement
The high-resolution satellite imagery data utilized in the empirical study, along with the Python code for extracting directional information between buildings, calculating the shortest edge distance between buildings, and constructing the directed weighted matrix, can be downloaded from Figshare at https://figshare.com/s/9c95aa99c13b73ab72da. Please note that the planning documents cannot be shared due to confidentiality constraints.