
Figures & data
Table 1. List of four different datasets used in this research.
Figure 1. (a) Location of Sichuan Province in China. (b) Map of High Human Activity (HHA) and Low Human Activity (LHA) zones used in this study, along with the boundaries of Sichuan cities. (c) The elevation map of Sichuan and the location of ground-based weather stations used in this study. (d) and (e) An example of air pollution in the Tianfu New Area, Chengdu City in December 2023.
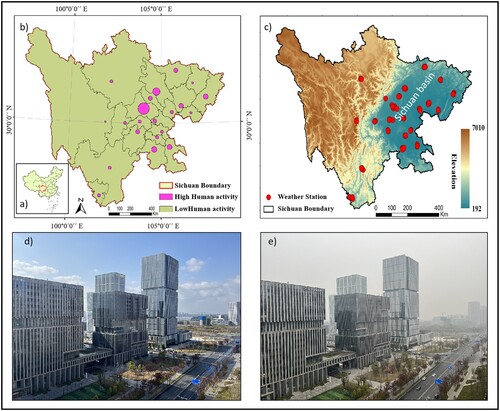
Figure 2. The main workflow of this study.
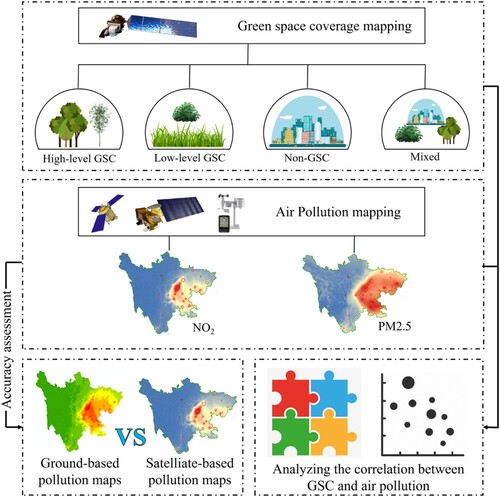
Table 2. Description of different GSC classes in this study.
Figure 3. An example of the generated GSC map for the HHA of Chengdu City, the capital of Sichuan province.
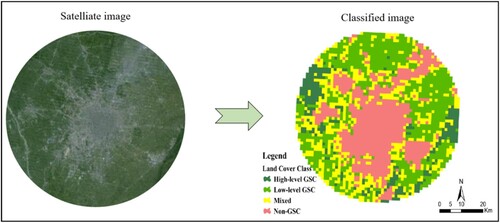
Figure 4. (a) & (b) Satellite-based NO2 retrieval for 2019 and 2022 over Sichuan Province. (c) Monthly mean value of NO2 over Sichuan Province. (d) Annual min, max, mean, and StDev values of NO2 over Sichuan Province. (e) & (f) Satellite-based PM2.5 retrieval for the years 2019 and 2022 over Sichuan Province. (g) Monthly mean value of PM2.5 over Sichuan Province. (h) Annual min, max, mean, and StDev values of PM2.5 over Sichuan Province.
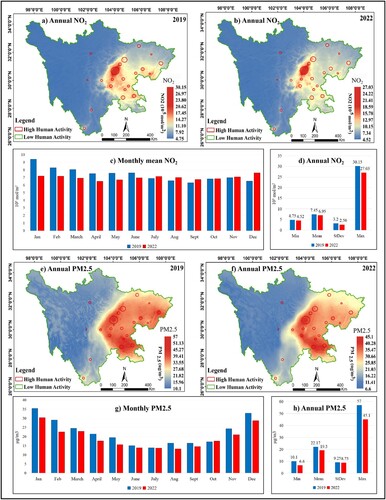
Figure 5. (a) Monthly mean value of PM2.5 in 2019 and 2022 over HHA and LHA regions. (b) Monthly mean value of NO2 in 2019 and 2022 over HHA and LHA regions. (c) Annual min, max, mean, and StDev values of NO2 in 2019 and 2022 over HHA and LHA regions. (d) Annual min, max, mean, and StDev values of PM2.5 in 2019 and 2022 over HHA and LHA regions.
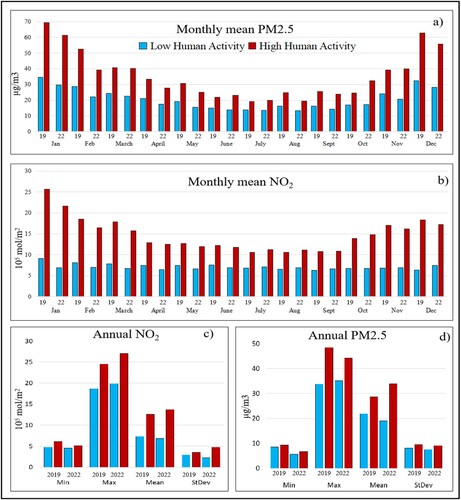
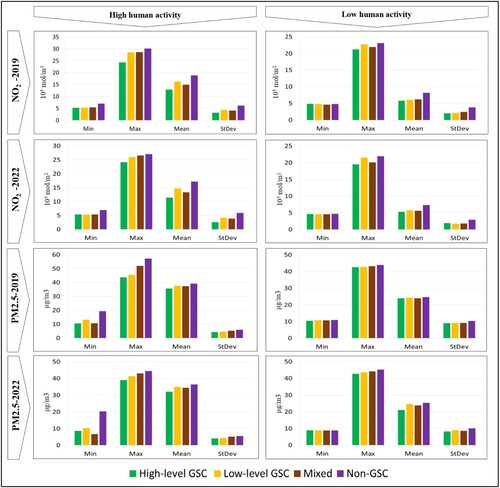
Figure 6. Annual min, max, mean, and StDev values for NO2 and PM2.5 pollutants for various GSC classes over HHA and LHA regions.
Data availability statement
Landsat-8 and satellite-based NO2 data are accessible for free download at https://developers.google.com/earth-engine/datasets; PM 2.5 data is also publicly available at https://weijing-rs.github.io/product.html. The ground-based NO2 and PM2.5 provided by the China national environmental monitoring center is available at http://www.cnemc.cn/.