Figures & data
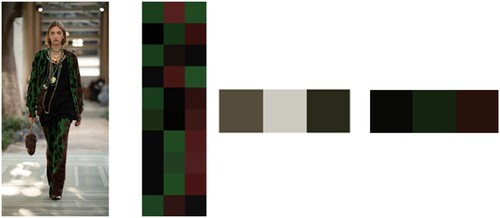
Figure 1. Two example images from the training set showing the corresponding annotated images that were produced for training purposes. The colour code used was black (null), green (shoes and accessories), cyan (hair), magenta (skin) and yellow (clothing).
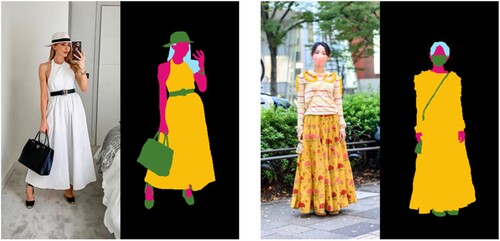
Figure 2. The collection of ten additional fashion images.
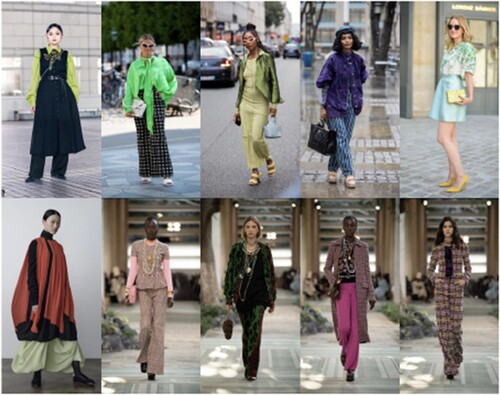
Figure 3. Schematic representation of the ΔEp palette difference metric. For each patch in each palette the closest patch in the other palette is found and the colour difference is calculated. In this case that results in 6 colour differences and these are averaged to produce the ΔEp value.
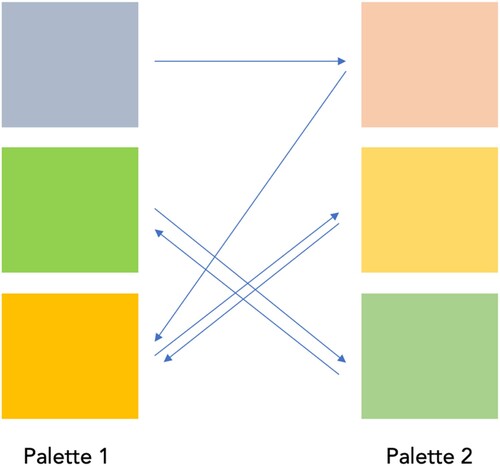
Figure 4. Example performance for the network trained for 40 epochs on input image (left). The output image (middle) shows the output of the network and 97% of the pixels are correctly classified compared with the ground truth data (right).
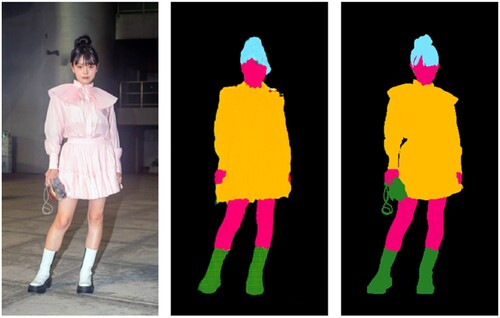
Table 1. Minimum, mean and maximum percent of pixels that were correctly classified for the validation set and the range between the upper band and lowest band in each epoch using the testing dataset.
Figure 5. F score distribution on clothes class on the testing set.
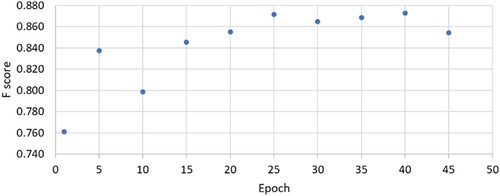
Figure 6. Application of the pix2pix trained network to one of the additional images (from left to right): original image and output image for the 40-epoch pix2pix network.
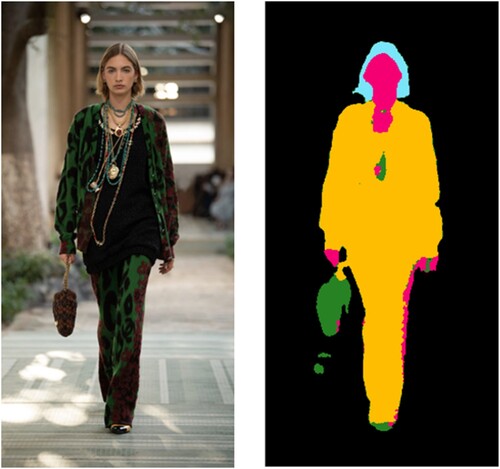
Figure 7. Sample image from the additional images (from left to right): the original image, the colours selected by the participants to represent the clothes in the experiment, the three colours selected by an application of k-means to the whole image, the three colours selected by an application of k-means to pixels that belong to the clothing or accessories class as denoted by the trained pix2pix network.