Figures & data
Figure 1. Mobile eye-tracker, camera configuration and video output with cross hairs showing gaze location.
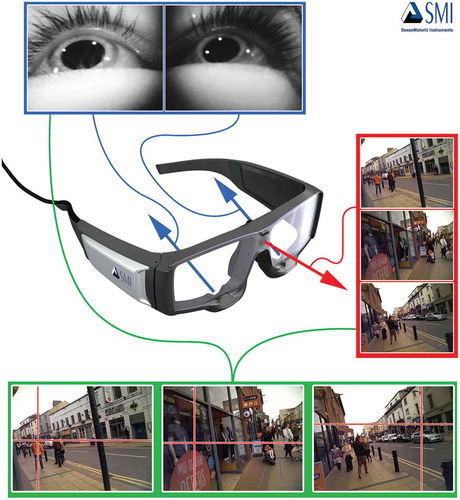
Table 1. Task details.
Figure 2. (a, b) Street DNAs detailing participants’ visual engagement with street areas of interest (AOIs). The total length of a single DNA equates to the total duration of a participant’s visual engagement on a street. The distribution of purple represents visual engagement with urban street edges.
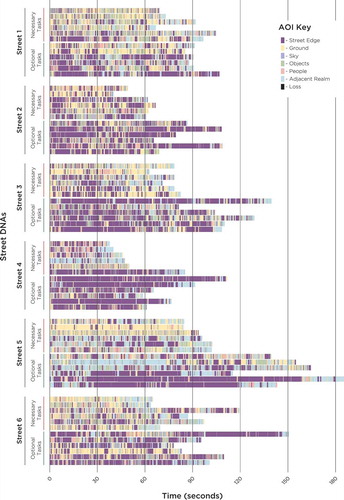
Figure 2. (Continued).
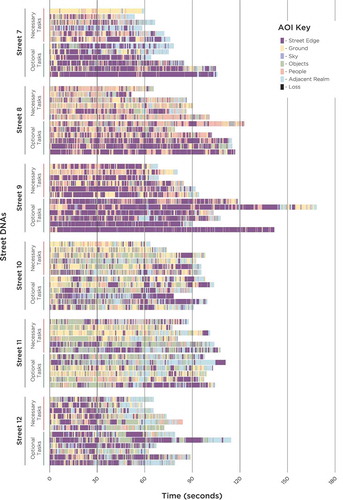
Figure 3. The percentage of participants’ visual engagement with street areas of interest (AOIs). Error bars represent 1 standard error.
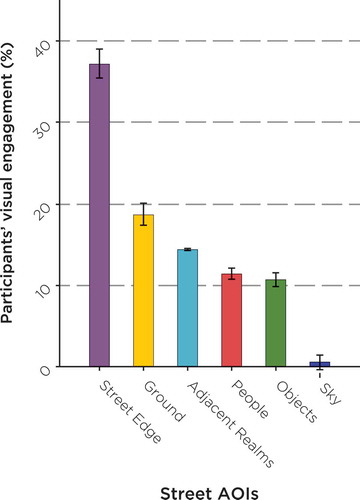
Figure 4. (a, b) The influence of task and street on the percentage of participants’ visual engagement with urban street edges. Error bars represent 1 standard error.
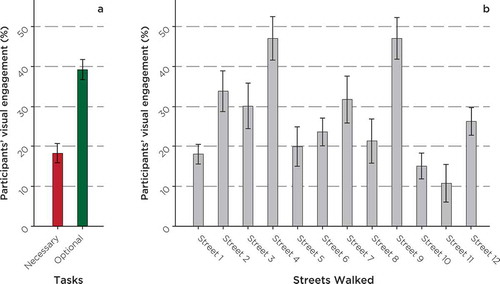
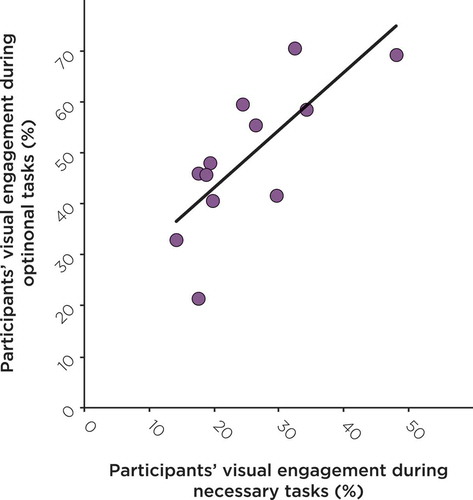
Figure 5. The correlation between the percentage of participants’ visual engagement with urban street edges during optional and necessary tasks (r = 0.69). Each point is the average data for one street.