
Figures & data
Figure 1. The location of Vlissingen (Netherlands) in the maritime system.
Figure 2. Synthetic storm surge for Vlissingen using the still water level (SWL) from HydraNL (10,000 year RP and 2100 climate change scenario W+) (elaboration: A. Diaz).
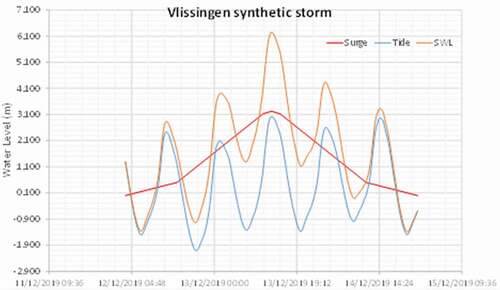
Table 1. The qualitative CBA for the Vlissings Model.
Figure 3. Spatial design strategy: the Vlissings Model; plan and prototypical section (elaboration: A. Bortolotti).
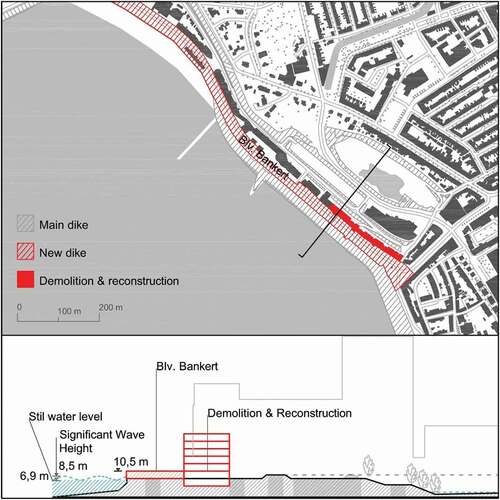
Figure 4. Spatial design strategy: the Spuikom Model; plan and prototypical section (elaboration: A. Bortolotti).
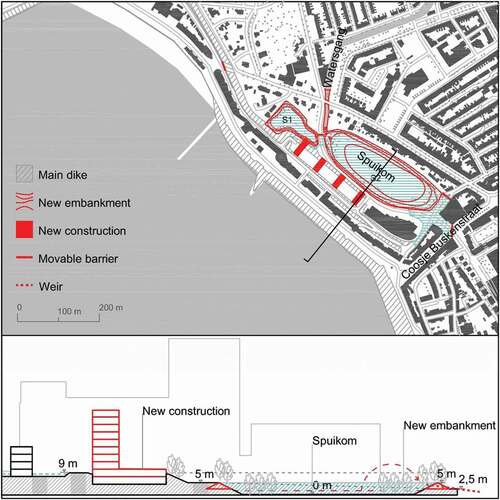
Figure 5. The results of the D&A framework - general overview: Maximum water depth map (a-c) and the corresponding total flood damage map (d-f) under extreme sea level at 1/10,000 p.Y in 2100 fora) Baseline strategy, b) Vilissings Model and c) Spuikom Model (elaboration: A.Bortolotti, A.Diaz,Q.Ke)
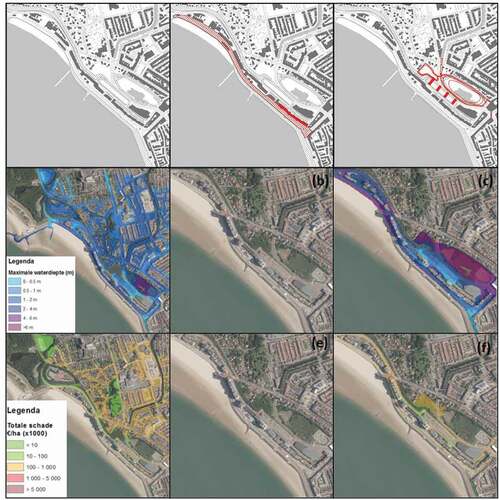
Table 2. The qualitative CBA for the Spuikom Model.
Table 3. Summary of flood economic damage, the number of total fatalities, and affected people, EDA and benefit for different strategies.
Table 4. The summary and comparative table of qualitative evaluation of each strategy.