Figures & data
Figure 1. The map of the research area.
Figure 2. The density of MORA complaints visualised on a map.
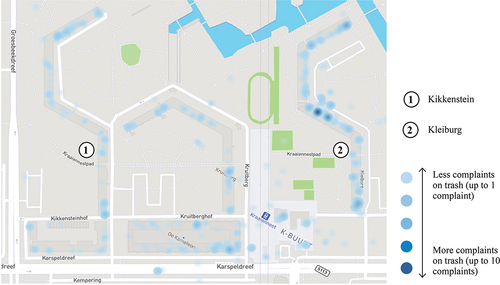
Figure 3. Maps representing the urban patterns of (1) spatial features, (2) social use, (3) cleaning types and (4) cleaning frequency and trash collection types.
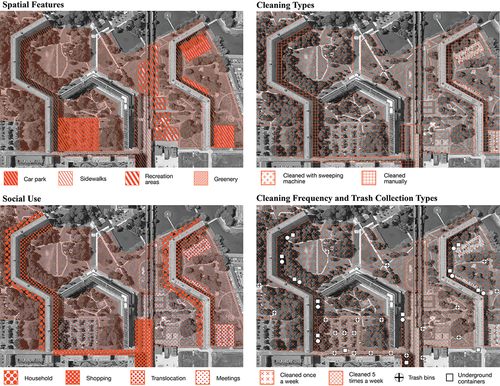
Figure 4. Visual explanation of the rhythm zone concept formulation.
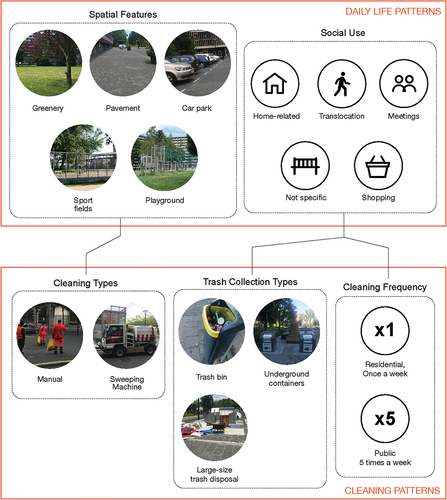
Figure 5. The rhythm zones on a map view.
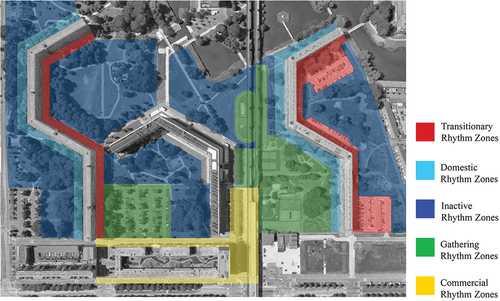
Figure 6. Maps displaying the spatial patterns and trash infrastructure in the surroundings of the domestic rhythm zones of both buildings. Photos showing the trash that appear in this area.
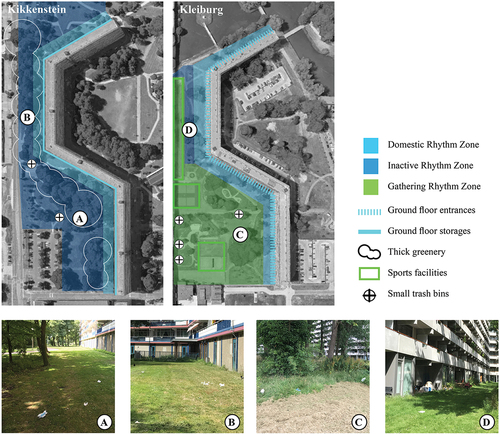
Figure 7. Photos of the domestic rhythm zones of Kleiburg and Kikkenstein (in order).
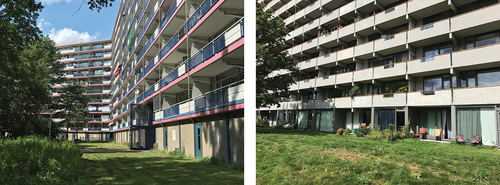
Figure 8. Maps displaying the spatial patterns and trash infrastructure in the surroundings of the transitionary rhythm zones of both buildings. Photos showing the trash that appears in this area.
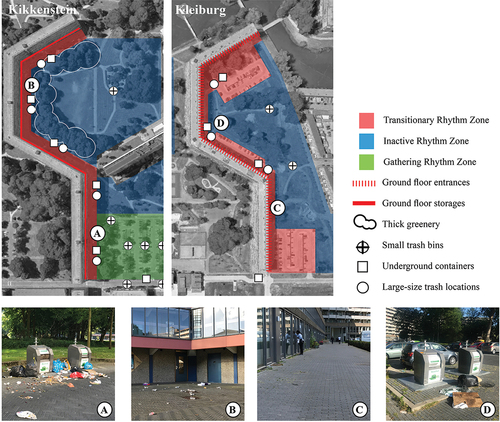
Figure 9. Photos of the transitionary rhythm zones of Kikkenstein and Kleiburg (in order).
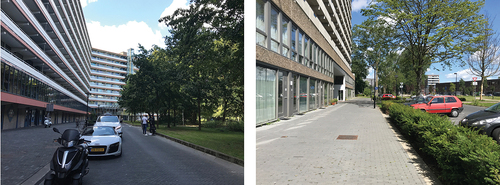
Figure 10. Photos of the inactive rhythm zones of Kikkenstein and Kleiburg (in order).
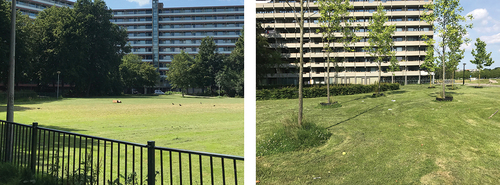
Figure 11. Maps displaying the spatial patterns and trash infrastructure in the surroundings of the gathering and commercial rhythm zones of both buildings. Photos showing the trash that appear in this area.
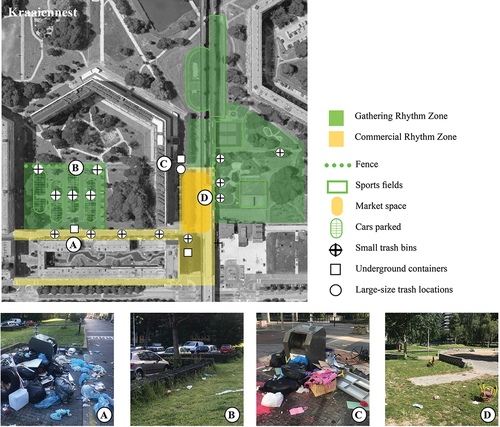
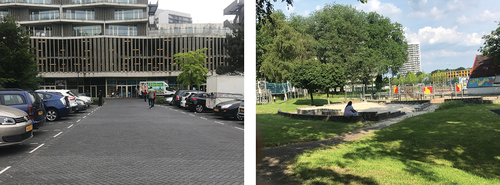
Figure 12. Photos of the gathering rhythm zones, Kikkenstein parking space and Kraaiennest playground (in order).