Figures & data
Table I. Participant demographics.
Table II. Participants’ current use of transcription pre-training.
Figure 1. Participants’ reported additional factors that impact their decision to use transcription. Number in brackets notes the number of meaning units in the main categories and subcategories.
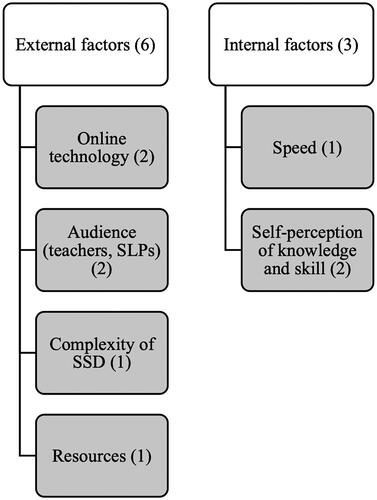
Table III. Pre- and post-training comparison of participants’ transcription accuracy (same vowel system).
Table IV. Pre-training (Mitchell-Delbridge) and post-training (Harrington, Cox and Evans) comparison of participants’ transcription accuracy.
Table V. Strategies and resources identified for maintaining transcription skills post-training (n = 20).
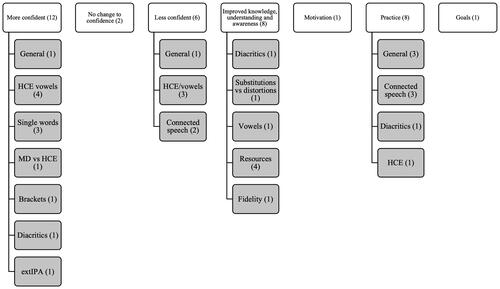
Figure 2. Participants’ reported changes in confidence post-training. The number in brackets notes the number of meaning units in the main categories and subcategories.