Figures & data
Figure 1. Two kinds of relationship between variables which have been investigated in respect of constraints affecting plants: (a) any constraint(s) apply on both sides of the trend line relating two aspects of plant performance, and the existence of a true trade-off is shown in any given interspecific comparison by complementary significant differences in properties A and B, and (b) any constraint(s) apply only on the side of the trend line towards higher values as any combination of lower values is feasible for plants in general, and the existence of a constraint for plants in general is shown by a sharply defined boundary to the cloud of points.
Figure 2. The three-way relationships among three of the six variables used by Wright et al. (Citation2004a) to define the ‘worldwide leaf economics spectrum’, based on data for 706 species; the direction of the data cloud in three-dimensional space is shown in the shadows projected on the wall and floor of the space. Reprinted by permission from Macmillan Publishers Ltd [Nature] copyright 2004.
![Figure 2. The three-way relationships among three of the six variables used by Wright et al. (Citation2004a) to define the ‘worldwide leaf economics spectrum’, based on data for 706 species; the direction of the data cloud in three-dimensional space is shown in the shadows projected on the wall and floor of the space. Reprinted by permission from Macmillan Publishers Ltd [Nature] copyright 2004.](/cms/asset/880cb409-4a3e-47d3-a02b-87be9060648a/tped_a_1048761_f0002_b.gif)
Figure 3. The Amass–Nmass–SLA relationships for Australian species of Eucalyptus (filled circles), Acacia (triangles) and Hakea (open circles), all axes log-scaled; SLA (specific leaf area) is the inverse of LMA used in (from Wright et al. Citation2004b). Originally published as Figure 3 in Functional Plant Biology 31(5): 556–558, doi:10.1071/FP03212 (I J Wright et al.) Copyright CSIRO 2004. http://www.publish.csiro.au/nid/102/paper/FP03212.htm. Reproduced with permission.
Table 1. The variables which may affect Nmass at a given LMA.
Table 2. Reasons why a trade-off might be expected between the growth rate in high irradiance and survival rate in deep shade, based on the work of various authors, mostly summarised by Bloor and Grubb (Citation2003).
Figure 4. The negative relationship between rate of height growth in high light and rate of survival in shade for nine species of tree in a North American temperate deciduous forest; the x-axis is ‘calculated from the slope of the growth function at zero light and the decay parameter (B) of a simplified mortality predictor’ (from Kobe et al. Citation1995). Used by permission.
Figure 5. The negative relationship between the responsiveness to greater irradiance (the log of the quotient of increase in dry mass in 4 months in 63% daylight [ΔM63] over the increase in 1.6% daylight [Δ1.6]) and survival rate in shade (combined data for 0.3% and 1.6% daylight) (from Grubb et al. Citation1996). Reproduced with permission of Wiley. Cm, Crataegus monogyna; Cs, Cornus sanguinea; Ee, Euonymus europaeus; Jc, Juniperus communis; Lv, Ligustrum vulgare; Rhc, Rhamnus catharticus; Rc, Rosa canina; Vl, Viburnum lantana; Vo, Viburnum opulus.
![Figure 5. The negative relationship between the responsiveness to greater irradiance (the log of the quotient of increase in dry mass in 4 months in 63% daylight [ΔM63] over the increase in 1.6% daylight [Δ1.6]) and survival rate in shade (combined data for 0.3% and 1.6% daylight) (from Grubb et al. Citation1996). Reproduced with permission of Wiley. Cm, Crataegus monogyna; Cs, Cornus sanguinea; Ee, Euonymus europaeus; Jc, Juniperus communis; Lv, Ligustrum vulgare; Rhc, Rhamnus catharticus; Rc, Rosa canina; Vl, Viburnum lantana; Vo, Viburnum opulus.](/cms/asset/b34cc712-4228-44d3-a988-8154eda00751/tped_a_1048761_f0005_b.gif)
Figure 6. The negative relationship between the rate of height growth in gaps and survival rate in deep shade for 112 species in tropical lowland moist forest on Barro Colorado Island, Panama; note lack of negative correlation for species with 90–95% or 95–100% survival in deep shade (from Hubbell and Foster Citation1992). Used by permission.
Figure 7. The lack of a correlation between RGR of dry mass measured over a year in 10% daylight (empty circles) or in 0.8% daylight (filled circles) and survival in 0.2% daylight for 15 species of initially highly shade-tolerant tree species of tropical lowland rainforest in north-eastern Queensland (from Bloor and Grubb Citation2003). Reproduced with permission of Wiley.
Figure 8. Scattergrams for indices of shade tolerance and drought tolerance for tree and shrub species in three regions of the Northern Hemisphere; the lines indicate standardised major axis regresssions. In the panel for European species, the points encircled are for species with high waterlogging tolerance and low drought tolerance; the inset shows a truncated data set with indices of waterlogging tolerance <2.5 (from Niinemets and Valladares Citation2006). Used by permission.
Figure 9. The relationship for 13 species of European temperate tree and shrub species between the quotient of RGR with strong drought over that with moderate drought under 30% daylight and the corresponding quotient for RGR under 3% daylight; for no species was the departure significantly different from the 1:1 line (from Sack Citation2004). Used by permission.
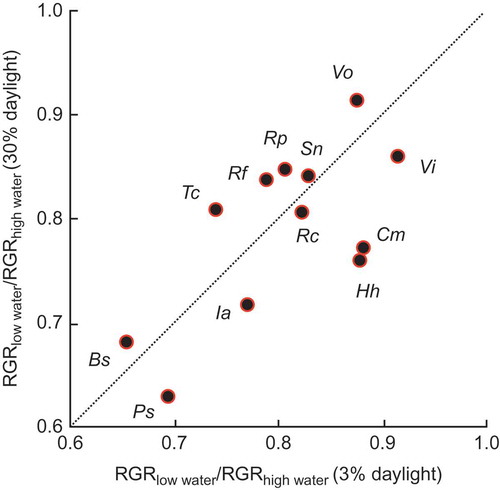
Figure 10. (a) Mediterranean climate sclerophyll forest, one of the forest types inflicting the most severe combination of shade and soil-desiccation, here on Majorca dominated by Quercus ilex; (b) the edge of the study site of Sack et al. (Citation2003) in forest in SW Spain dominated by Quercus suber (evergreen sclerophyll) and Q. canariensis (semi-deciduous) photographed in early April before the Q. canariensis had leafed out; (c) a shoot of Viburnum tinus grown in deep shade under Quercus ilex in Italy.
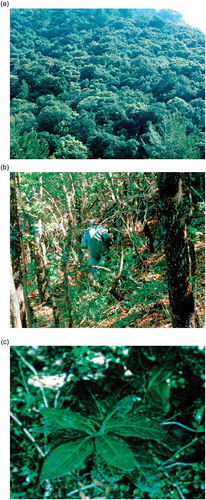
Table 3. The contrasting key features of plants able to resist waterlogging and those able to resist drought.
Figure 11. (a) Hydrologically defined niche space in an extensive floodplain meadow is southern England based on sum exceedence values for soil aeration (SEVa, reflecting frequency of flooding) and soil dryness (SEVd, indicating frequency of drought); (b) the negative correlation between the mean SEVs weighted by abundance for the 51 plant species that occurred in 50 or more of the 641 quadrats; (c) the negative correlation between the mean SEVs for soil aeration and soil dryness for 99 floodplain meadow species in southern England (empty circles) and 96 fynbos species in South Africa (filled circles). (a) and (b) from Silvertown et al. (Citation1999), reprinted by permission from Macmillan Publishers Ltd [Nature] copyright 1999. (c) from Araya et al. (Citation2011), reproduced with permission of Wiley.
![Figure 11. (a) Hydrologically defined niche space in an extensive floodplain meadow is southern England based on sum exceedence values for soil aeration (SEVa, reflecting frequency of flooding) and soil dryness (SEVd, indicating frequency of drought); (b) the negative correlation between the mean SEVs weighted by abundance for the 51 plant species that occurred in 50 or more of the 641 quadrats; (c) the negative correlation between the mean SEVs for soil aeration and soil dryness for 99 floodplain meadow species in southern England (empty circles) and 96 fynbos species in South Africa (filled circles). (a) and (b) from Silvertown et al. (Citation1999), reprinted by permission from Macmillan Publishers Ltd [Nature] copyright 1999. (c) from Araya et al. (Citation2011), reproduced with permission of Wiley.](/cms/asset/d47f3fe0-12d3-48f9-98df-e4fe06c769fc/tped_a_1048761_f0011_oc.jpg)
Figure 12. Scattergrams for indices of drought tolerance and waterlogging tolerance for tree and shrub species in three regions of the Northern Hemisphere; the lines indicate standardised major axis regressions (from Niinemets and Valladares Citation2006). Used by permission.
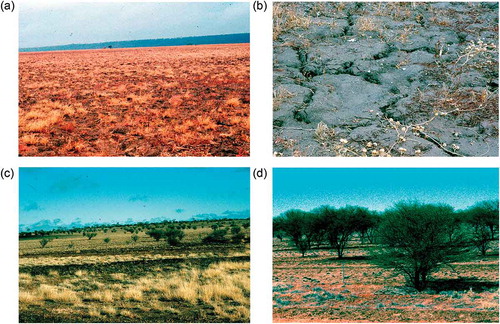
Figure 13. (a) ‘Mitchell grassland’ on deeply cracking clay soil, dominated by Astrebla spp., over-grazed but still free of Acacia nilotica, in north-eastern Queensland, 21 km north of Hughenden; (b) the cracking clay at the site in (a) at the end of a long rainless period; (c) an area moderately infested with Acacia nilotica, just west of Hughenden; (d) an old infestation of the Acacia 140 km west of Hughenden; all photographs taken in early August 1995.