Figures & data
Table 1. Adaptive morphological, physiological, and phenological mechanisms and/or traits of Quercus ilex for withstanding summer droughts.
Figure 1. Monthly average difference between the monthly precipitation and the monthly potential evapotranspiration (the climatic water balance) for two forests dominated by Quercus ilex. Data were obtained from meteorological stations located at Torners Valley in the Prades Mountains (930 m a.s.l; 1998–2014) and at Viladrau in the Montseny Mountains (950 m a.s.l. 1995–2014). Potential Evapotranspiration is calculated with the SPEI package in R, based on monthly temperature and incoming solar radiation. Error bars are the standard errors of the means.
Figure 2. Map of the current distributional range of holm oak (Quercus ilex) in the Mediterranean Basin.
Table 2. Characteristics of reported drought-induced dieback in Quercus ilex forests involving crown defoliation and/or stem mortality based on the values the drought index SPEI, calculated as defined in the text. CD, crown defoliation, SM, stem mortality.
Figure 3. Correlation heat map between the annual relative change in crown defoliation and the SPEI values for Iberian Quercus ilex forests (1987–2013, 233 plots). The SPEI duration on the x-axis represents the number of months used to calculate the water balance (e.g. an SPEI duration of 3 in June is calculated using the water balance of the previous April and May and the June itself). The y-axis is the month in which the calculation of SPEI departs from. The panel on the right top indicates the correspondence of the colours in the heat map with the Person’s r coefficient of the correlation between SPEI and defoliation.
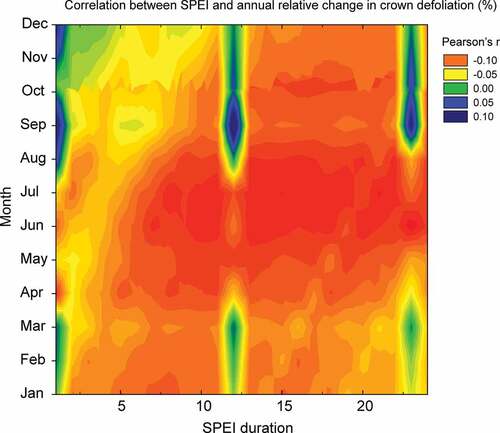
Figure 4. Time courses of (a) accumulated crown defoliation and (b) annual change in crown defoliation relative to defoliation from the previous years (red lines). Blue bars are the June SPEIs calculated at a timescale of 23 months, which was the best correlated index. Error bars are the standard errors of the means (N = 233).
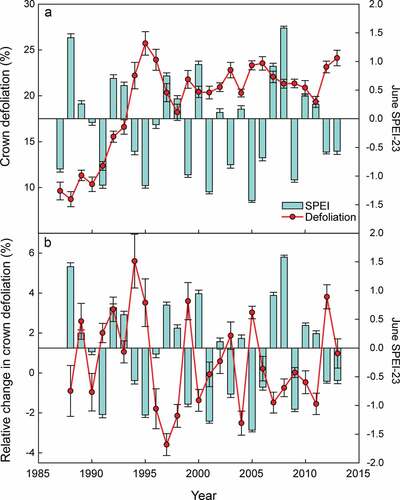
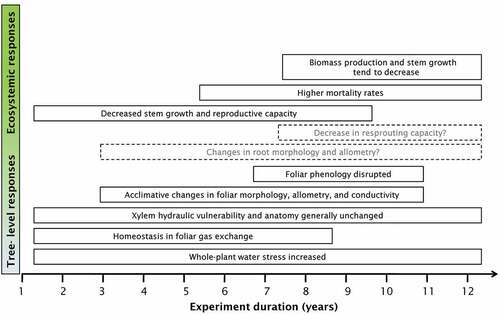
Table 3. Summary of the effects identified by studies of long-term experimental drought in Quercus ilex forests.
Figure 5. Conceptual scheme of the most relevant effects of the long-term drought experiments in Quercus ilex forests at the tree and ecosystemic levels. The span of the rectangles defines the duration of the effects. The rectangles that surpass 12 years indicate effects that lasted till the present day of the experiment. The position on the x-axis represents the approximate time of appearance. Rectangles with dashed contour lines indicate potential effects that require further study.