Figures & data
Figure 1. Sphagnum cover on September 2015, when time since fire ranged 306–705 days (mean = 514) for the different burns. Values are shown for all species identified as well as total Sphagnum cover (‘total’) in each treatment: unburnt, low severity burnt (‘no-drought’) and high severity burnt (‘drought’). Average Sphagnum cover was 6.3% (SD = 8.7%) across all plots. Height of the box is the interquartile range, the horizontal bar is the median, whiskers extend to 1.5 times the first or third quartile, circles are outliers. The same letters above the boxplots of total Sphagnum cover indicate that differences between treatments were not statistically significant (α = 0.05). Statistical testing details are provided in Table S1.
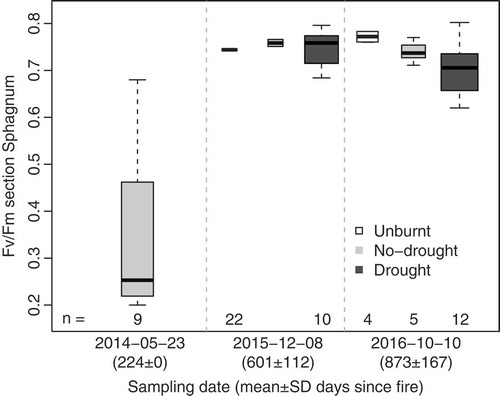
Figure 2. Boxplots of the chlorophyll fluorescence Fv/Fm ratio of S. capillifolium capitula, for the different plot treatments and sampling dates. Width of the box is proportional to the number of observations, provided below each boxplot. Different letters above boxplots within sampling date indicate significant differences (α = 0.05). Generally, wet weather before sampling meant Sphagnum was probably not stressed due to desiccation. See Supplementary material for statistical testing details (Tables S2 and S3), weather information (Table S4) and Fv/Fm vs. time since fire for individual samples (Figure S1).
Figure 3. Boxplots of the chlorophyll fluorescence Fv/Fm ratio of S. magellanicum (n = 23), S. papillosum (n = 13) and S. palustre (n = 8) capitula, for the different plot treatments and sampling dates. Width of the box is proportional to the number of observations, provided below each boxplot. See Figure S2 for Fv/Fm against days since fire of individual samples.