Figures & data
Table 1. Average date and day of year (DOY; with standard errors) of snowmelt timing and average accumulated thawing degree days (TDD) after snowmelt at two sites (North and South) and three levels of snowmelt timing (Early, Mid and Late) in 2014 and 2015.
Figure 1. Number of days after snowmelt and day of year on which four vegetative phenophases (bud green, leaf unfolded, leaf expanded, leaf senescence) in five subarctic dwarf shrubs (a–e) occurred for the first time along a natural gradient of snowmelt timing (Early, Mid and Late). The phenophases were observed at two mountain slope aspects (North and South). Closed symbols denote observations from 2014 and open symbols observations from 2015. The solid schematic lines (in red) indicate the generalised trend in the phenophase shifts along the snowmelt gradient. A flat line corresponds to no shift along the snowmelt gradient in all or most pairwise comparisons. No red line indicates that no clear pattern was identified. For full species’ names and description of the snowmelt gradient see Materials and methods section. Note that overlapping points have been jittered.
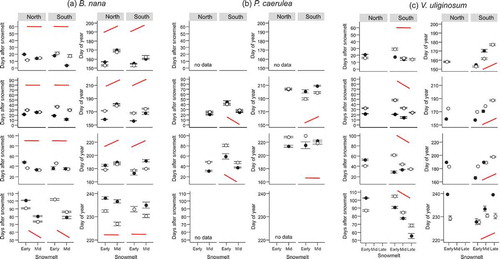
Figure 1. Number of days after snowmelt and day of year on which four vegetative phenophases (bud green, leaf unfolded, leaf expanded, leaf senescence) in five subarctic dwarf shrubs (a–e) occurred for the first time along a natural gradient of snowmelt timing (Early, Mid and Late). The phenophases were observed at two mountain slope aspects (North and South). Closed symbols denote observations from 2014 and open symbols observations from 2015. The solid schematic lines (in red) indicate the generalised trend in the phenophase shifts along the snowmelt gradient. A flat line corresponds to no shift along the snowmelt gradient in all or most pairwise comparisons. No red line indicates that no clear pattern was identified. For full species’ names and description of the snowmelt gradient see Materials and methods section. Note that overlapping points have been jittered.
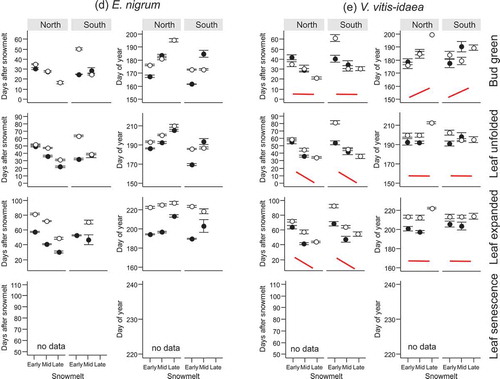
Figure 2. Number of days after snowmelt and day of year on which four vegetative phenophases (bud green, leaf unfolded, leaf expanded, leaf senescence) in two subarctic dwarf shrubs (a–b) occurred for the first time. The phenophases were observed at two mountain slope aspects (North and South) in a late-melting snowbed. Closed symbols denote observations from 2014 and open symbols observations from 2015. For full species’ names and description of the snowmelt gradient see Materials and methods section. Note that overlapping points have been jittered.
Figure 3. Number of days after snowmelt and day of year on which four reproductive phenophases (flower open, flower senescence, fruit set visible, fruit ripe) in four subarctic dwarf shrubs (a–d) occurred for the first time along a natural gradient of snowmelt timing (Early, Mid and Late). The phenophases were observed at two mountain slope aspects (North and South). Closed symbols denote observations from 2014 and open symbols observations from 2015. The solid schematic lines (in red) indicate the generalised trend in the phenophase shifts along the snowmelt gradient. A flat line corresponds to no shift along the snowmelt gradient in all or most pairwise comparisons. No red line indicates that no clear pattern was identified. For full species’ names and description of the snowmelt gradient see Materials and methods section. Note that overlapping points have been jittered.
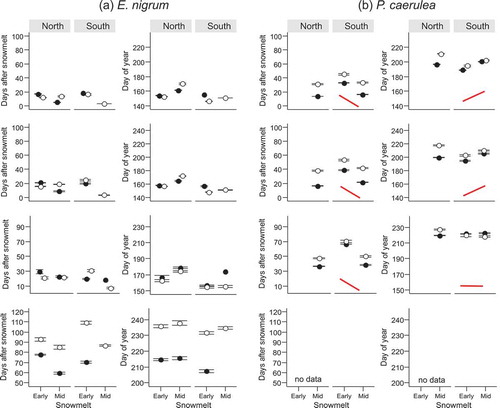
Figure 3. Number of days after snowmelt and day of year on which four reproductive phenophases (flower open, flower senescence, fruit set visible, fruit ripe) in four subarctic dwarf shrubs (a–d) occurred for the first time along a natural gradient of snowmelt timing (Early, Mid and Late). The phenophases were observed at two mountain slope aspects (North and South). Closed symbols denote observations from 2014 and open symbols observations from 2015. The solid schematic lines (in red) indicate the generalised trend in the phenophase shifts along the snowmelt gradient. A flat line corresponds to no shift along the snowmelt gradient in all or most pairwise comparisons. No red line indicates that no clear pattern was identified. For full species’ names and description of the snowmelt gradient see Materials and methods section. Note that overlapping points have been jittered.
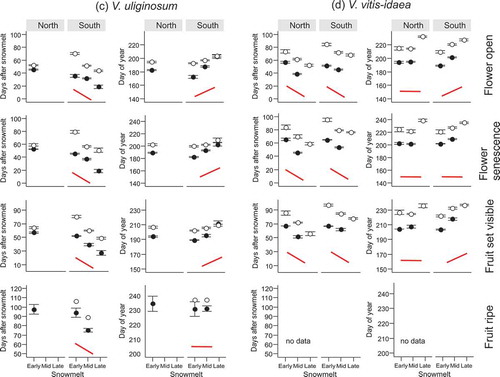
Figure 4. Number of days after snowmelt and day of year on which four reproductive phenophases (flower open, flower senescence, fruit set visible, fruit ripe) in V. myrtillus occurred for the first time. The phenophases were observed at two mountain slope aspects (North and South) in a late-melting snowbed. Closed symbols denote observations from 2014 and open symbols observations from 2015. For full species’ names and description of the snowmelt gradient see Materials and methods section. Note that overlapping points have been jittered.
Figure 5. Schematic representation of patterns in plant phenology with regards to snowmelt timing. Phenological timing is represented as days after snowmelt (DAS) until the onset of a phenophase (continuous line) and as the day of year (DOY) of the onset of a phenophase (dashed line). The occurrence of phenophases in response to snowmelt timing clustered in the present study into three patterns: (a) Compensation: The number of DAS required to reach a certain phenophase decreases with later snowmelt timing. This reduction translates into acceleration of growth and compensates for the delay caused by the late snowmelt, leading to synchronous occurrence of the observed phenophases in plots with different snowmelt timing. (b) Under-compensation: The number of DAS required to reach a certain phenophase decreases with later snowmelt timing but this acceleration is not sufficient to compensate for the delayed start of the growing season caused by late snowmelt. Therefore, phenophases are reached at a later DOY in late-melting plots compared to early melting plots, but this difference is smaller than the corresponding difference in the snowmelt timing. (c) Conservativeness (no compensation): The number of DAS required to reach a certain phenophase is the same along the snowmelt gradient. Late snowmelt poses a natural delay to development so that phenophases occur at a later DOY in late- compared to early melting plots and this difference is equal to the corresponding difference in the snowmelt timing.
Note the different slopes in the solid lines in figure parts (a) and (b) and the dashed lines in figure parts (b) and (c).