Figures & data
Figure 1. In vitro growth of DSEs on different forms of N and P. Periconia macrospinosa (Per) and Cadophora sp. (Cad) were grown for 2 weeks on solid media. N and P were both supplied in inorganic forms (a) and organic forms (b). N was supplied in organic form, and P was supplied in inorganic form (c). P was supplied in organic form, and N was supplied in inorganic form (d). Two-way ANOVA (P = 0.05, n = 3) was carried out on the square-root-transformed data, resulting in no significant impact of either the ‘media’ or ‘DSE’ factor and an absence of interactions.
Figure 2. Impact of DSEs on tomato vegetative growth (first pot-experiment). Tomato plants were non-inoculated (Ctrl), inoculated with Periconia macrospinosa (Per) or inoculated with Cadophora sp. (Cad) and were grown in organically fertilised (Org) or inorganically fertilised (Inorg) soils. The dry weight of roots and shoots was measured. After log-transformation, two-way ANOVA (P = 0.05, n = 11–12) was carried out, showing that the factor ‘DSE’ had a significant impact on the dry weight (dw) of shoots, but there was no interaction between ‘DSE’ and ‘fertilisation’. The Kruskal–Wallis test (P = 0.05, n = 11–12) showed that root dry weight (dw) was also influenced by the factor ‘DSE’, and all plant growth parameters were influenced by the factor ‘fertilisation’. Significant differences between inoculated and non-inoculated plants are indicated by asterisks (Kruskal–Wallis test; P = 0.05, n = 11–12).
Figure 3. Impact of DSEs on the concentrations of nitrogen (N), phosphorus (P) and carbon (C) (first pot experiment). Tomato plants were non-inoculated (Ctrl), inoculated with Periconia macrospinosa (Per), or inoculated with Cadophora sp. (Cad) and grown in organically fertilised (Org) or inorganically fertilised (Inorg) soils. Concentrations of elements were measured. The Kruskal–Wallis test (P = 0.05, n = 11–12 for ‘Inorg’, 3–5 for ‘Org’) showed an impact of the factor ‘fertilisation’ on the concentrations of both elements in plant shoots. Two-way ANOVA (P = 0.05, n = 11–12 for ‘Inorg’, 3–5 for ‘Org’) showed an impact of the factor ‘inoculation’ on the concentration of P. Significant differences between inoculated and non-inoculated plants are indicated by asterisks (Tukey’s test; P = 0.05, n = 11–12 for ‘Inorg’, 3–5 for ‘Org’).
Figure 4. Effect of DSE inoculation on tomato growth (pot experiment with compartments). Tomato plants were non-inoculated (Ctrl), inoculated with Periconia macrospinosa (Per), or inoculated with Cadophora sp. (Cad) and grown in the presence of compartments. Pots contained inorganic forms of N and P, and compartments contained organic forms of N and P. The dry weight (dw) of roots and shoots was measured. One-way ANOVA (P = 0.05, n = 12) followed by Tukey’s post-hoc test showed significant differences between treatments. Significant differences between inoculated and non-inoculated plants are indicated by asterisks.
Figure 5. Structures in the roots of Periconia macrospinosa-inoculated tomato plants visualised using a specific FISH probe labelled with Alexa Fluor 488. Blue arrow: growing microsclerotium. Roots were screened using the EVOS™ FL Cell Imaging System (Life Technologies, CA, USA).
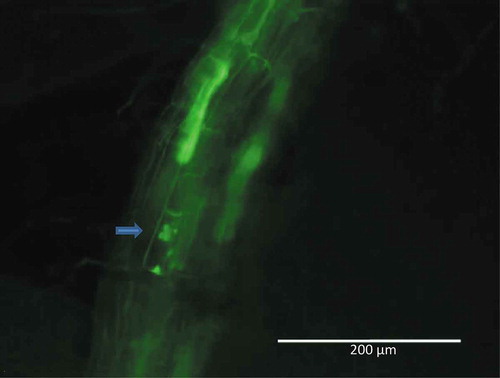
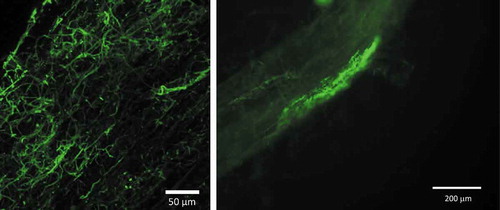
Figure 6. Hyphae of Cadophora sp. visualised in tomato roots using specific FISH probes labelled with Alexa Fluor 488. Photographs were taken using a Leica SP8 confocal laser scanning microscope (left) and a Nikon Eclipse 80i fluorescence microscope (right).