Figures & data
Figure 1. Elements of plant networks. Plant networks are composed by nodes (e.g. species, individuals, genotypes, phenotypes, functional groups, vegetation patches) connected by links (e.g. competition, facilitation, commensalism, parasitism, co-occurrence). Nodes and links are represented in matrices and therefore network objects. A matrix can be either square for unipartite networks or rectangular for bipartite networks. Several matrices can be further combined in plant multilayer networks.
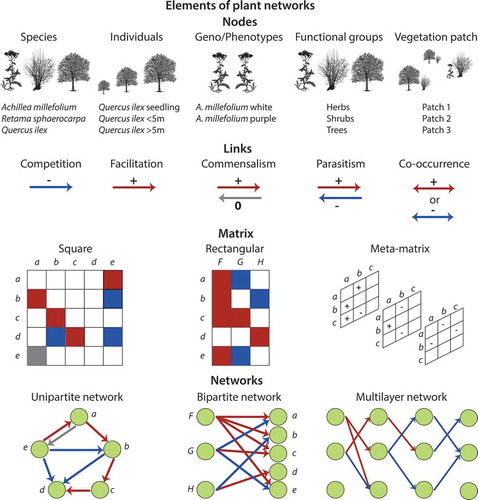
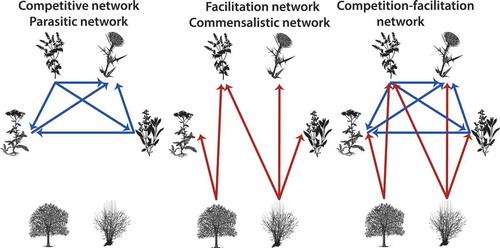
Figure 2. Types of plant networks. Competition-facilitation networks are composed by both competitive (blue) and facilitative (red) interactions. Competitive or parasitic networks are composed only by negative interactions, while facilitation and commensalistic networks are composed only by positive interactions.
Box 1. Effects of livestock grazing on a spatial plant network.
Figure B1. Plant spatial networks for the natural (left) and overgrazed (right) communities in Mediterranean ecosystems (South East Spain). Nodes (dots) represent plant species, blue links represent positive links (aggregation) and red links represent negative links (segregation).
Overgrazing had a strong impact on the structure of plant networks (, ). Overgrazing substantially simplified the community and caused the loss of many positive associations between species, mainly as a result of reduced richness, as can be seen from the increase in the values of NC and contemporary decrease in D and R (). In particular, overgrazing breaks the patchy structure of the vegetation, precluding the persistence of species that require the presence of plant patches to survive. Interestingly, both communities show a modular organization, indicating the resistance of plant networks to overgrazing. However, the modular network structure relies only on one single species in overgrazed communities, the unpalatable species at the center of the network (), thus making the network more vulnerable. These results shed new light on the profound consequences of overgrazing on the structure and functioning of plant communities.
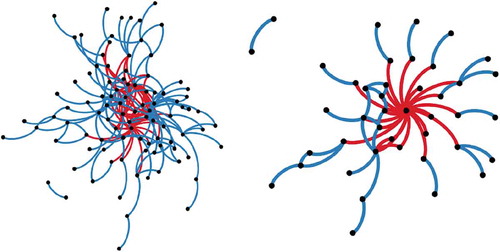
Table B1. Structure of spatial networks in two communities with different livestock grazing intensity. NC is the proportion of non-connected species; D is the link density; R is the link ratio; M is the modularity. ** and *** indicate that modularity is significantly higher than expected by 1000 random networks.
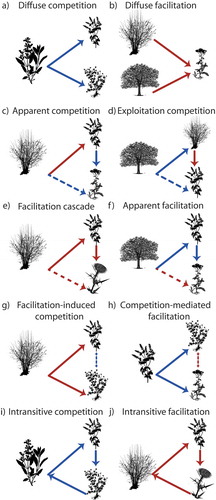
Figure 3. Indirect effects among plants. Diffuse interactions (a-b), interaction chains and higher-order interactions (c-h), intransitive interactions (i-j).