Figures & data
Figure 1. Aerial view of post-dieback stand structure in a Scots pine (Pinus sylvestris) stand severely impacted by the drought in 2012, Corbalán, Aragón, north-eastern Spain. Note that the surviving individuals are of drought-tolerant tree species: Pinus nigra, Juniperus thurifera, Quercus ilex and Quercus faginea. The inset shows a dead Pinus sylvestris with individuals of J. thurifera in the midstorey
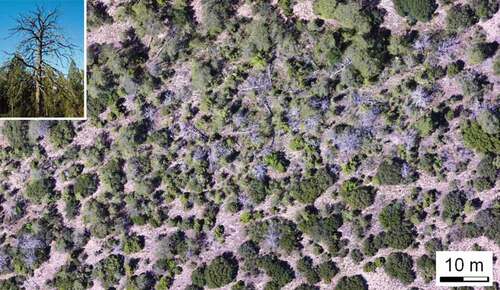
Figure 2. Drought-induced dieback is usually triggered by extreme dry spells. In this example, a very low annual climatic annual water balance in 2017 (dotted red line) characterised a dieback episode that affected a Mediterranean Pinus pinaster stand located near Miedes de Aragón, north-eastern Spain. The year 2017 was characterised by one of the driest growing seasons in the region during the last 100 years
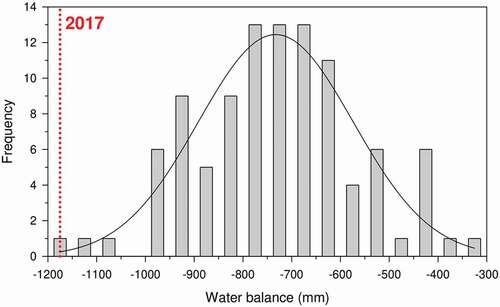
Figure 3. Early-warning signals vigour of drought-triggered mortality appear to be species specific and reflect how different tree species cope with drought stress. The plot shows the divergence in growth between non-declining and declining Abies alba trees about 20 years before the onset of dieback in 2012. Modified from Camarero et al. (Citation2015)
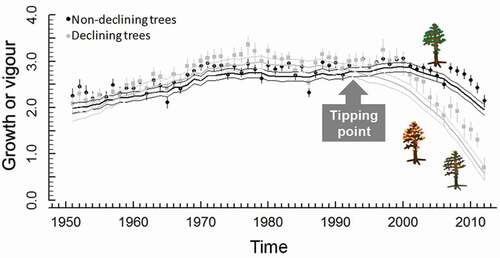
Figure 4. Different views on intra-specific relationships between tree size (total height) and vulnerability to drought-induced dieback and mortality (represented as trees with red, yellow and shedding leaves): (a) according to hydraulic and allometry relationships (dashed line) between tree height and conduit diameter, the tallest trees are those more prone to dying; however (b) large trees can also store more water (higher hydraulic capacitance) and develop large root systems reaching deep soil water than mid-size trees leading to higher damage in in the latter. Modified from Camarero (Citation2020)
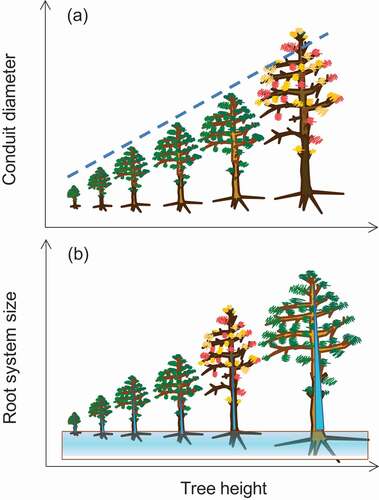
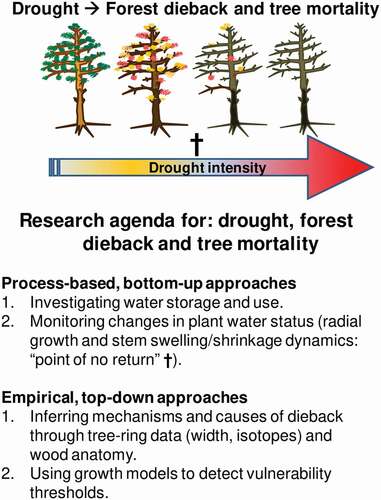
Figure 5. Conceptual figure summarising the research agenda proposed to investigate the causes and mechanisms of forest dieback and tree mortality after drought. The two approaches correspond to sections of the main text that describe process-based and empirical approaches. The cross along the gradient of drought intensity (arrow) indicates the ‘point of no return’ preceding tree mortality, which occurs when stem radial growth ceases and diurnal stem diameter fluctuations decrease due to irreversible stem shrinkage (see Lamacque et al. Citation2020; Preisler et al. Citation2021)