
Figures & data
Figure 1. Location of the Páramo El Verjón-Matarredonda, north-eastern Colombian Andes, at 3250 m a.s.l. and the location of the plots along a moisture gradient. The 10 study plots (white dots) were selected from 100 points (yellow dots) generated by the iSDM package to assess soil moisture availability. Colours in the map show the flow accumulation index obtained from the aspect map (direction of the slope in degrees) and the slope map (angle of inclination of the terrain).
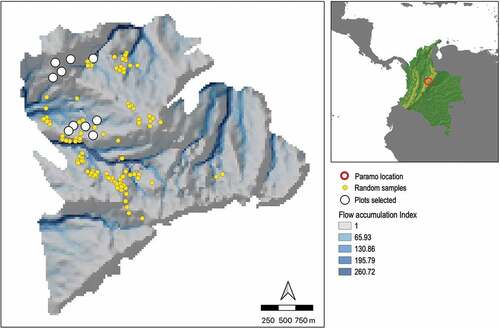
Figure 2. Aerial photographs (left) and water content maps (right) for the 10 plots of study, Páramo El Verjón-Matarredonda, north-eastern Colombian Andes, at 3250 m a.s.l. The soil water content is expressed as volume of water (m3) per volume of soil (m3).
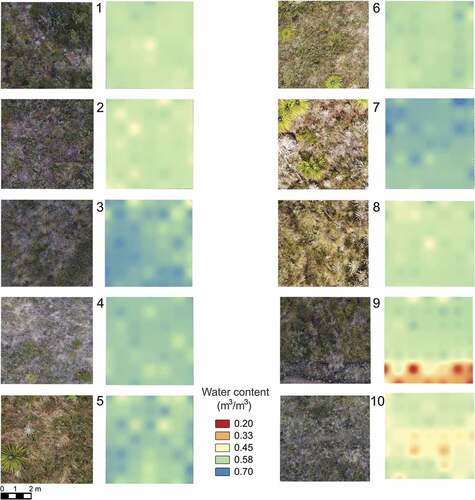
Figure 3. PCA created using soil environmental variables and plant cover of the main growth forms found in the 1 m2 plot around each plant of the analysed species in all 10 plots established along a moisture gradient, Páramo El Verjón-Matarredonda, north-eastern Colombian Andes, at 3250 m a.s.l. The upper panel shows the distribution of species along the first axis of variation (PC1) related to microtopographic variables and the second axis related to vegetation structure (PC2) highly correlated with shrub and grass cover. The bottom panel shows the distribution of species along the first axis of variation (PC1) related to microtopographic climatic variables and the third axis of variation (PC3) mainly correlated with moss cover.
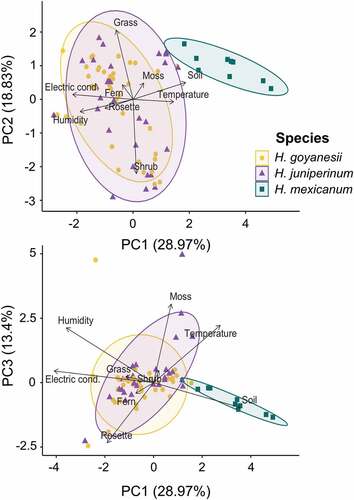
Figure 4. Soil water content measured under each plant of each of the analysed species in all 10 plots established along the moisture gradient, Páramo El Verjón-Matarredonda, north-eastern Colombian Andes, at 3250 m a.s.l. Box plots show means and standard errors. Different letters indicate statistically significant differences among Hypericum species.
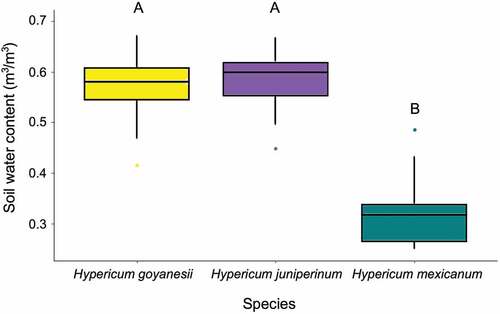
Figure 5. Values of predawn and midday leaf water potential measured during the dry season of 2017 on three branches from 10 individuals of each Hypericum species, Páramo El Verjón-Matarredonda, north-eastern Colombian Andes, at 3250 m a.s.l. Different letters indicate statistically significant differences among Hypericum species.
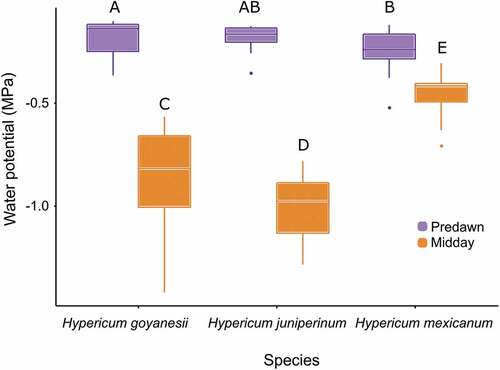
Figure 6. Vulnerability curves for Hypericum goyanesii (yellow line and diamonds) and H. juniperinum (purple line and dots) and their 95% confidence intervals. Vertical lines show the water potential when 50% of the xylem conductivity is lost (Ψ50). the triangle on the x-axis shows the minimum water potential during the dry season (Ψmin) and the bars next to it show the safety margin (HSM50 = Ψmin - Ψ50). the inner table show all these hydraulic parameters and the ones calculated when 88% of the xylem conductivity is lost. P-values in the last column correspond to the comparison among the two species.
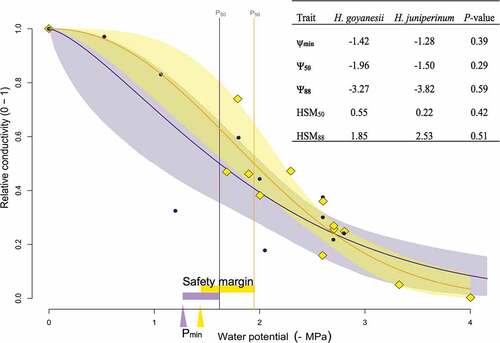
Table 1. Mean ± standard errors of anatomical traits associated with vulnerability to drought in three Hypericum species, Páramo El Verjón-Matarredonda, north-eastern Colombian Andes, at 3250 m a.s.l. VDiam, vessel diameter; VDen, vessel density; VI, vulnerability index. Different letters in a row indicate that traits are significantly different among species.
Supplemental_material
Download MS Word (2.9 MB)Data availability statement
The data that support the findings of this study are available from the corresponding author upon reasonable request.