Figures & data
Figure 1. Tracks of cyclones Phailin (red), Hudhud (magenta) and Nilofar (green). The positions at 00UTC are marked along the track. The locations of buoys at Gopalpur, Visakhapatnam (VSK), Pondicherry and AD06 are marked in blue.
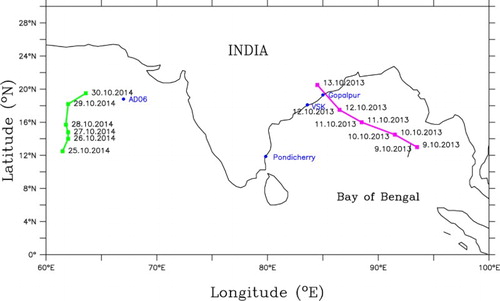
Table 1. Description of different wave models.
Table 2. RMSE (in °C) between observation and ensemble members and model predictions of SST for March, April and May with January initial condition.
Figure 2. RMSE (in second) of ensemble and individual model predictions of wave period during SWM of 2014 at Pondicherry.
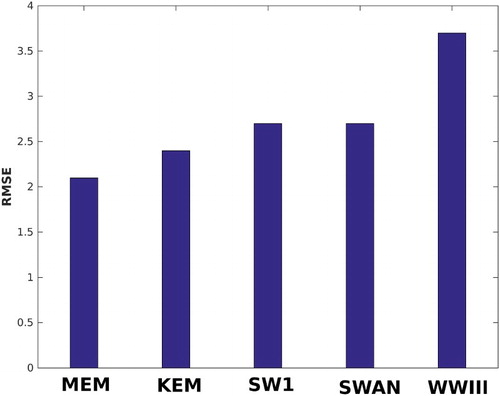
Table 3. RMSE (in metre) and Scatter Index of ensemble and individual model predictions of significant wave height during the southwest monsoon of 2014 and during Nilofar, Hudhud and Phailin cyclones.
Figure 3. Significant wave height (in metre) is plotted for different model outputs, observation and ensemble predictions at the time of Nilofar.
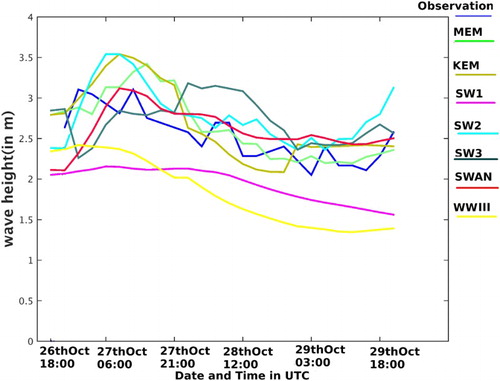
Figure 4. Significant wave height (in metre) is plotted for different model outputs, observation and ensemble predictions at the time of Hudhud.
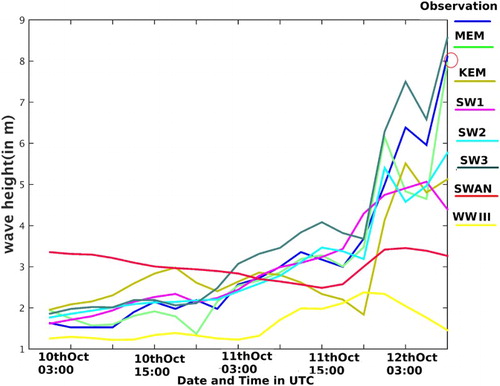
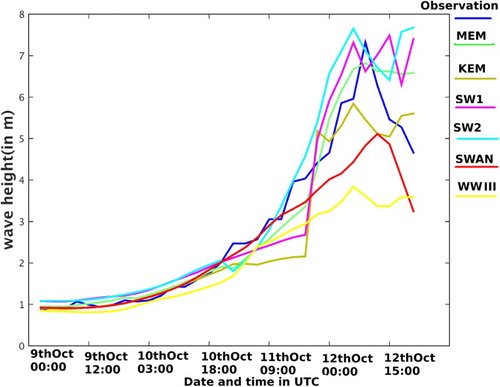
Figure 5. Significant wave height (in metre) is plotted for different model outputs, observation and ensemble predictions at the time of Phailin.