Figures & data
Figure 1. Geographic location of the Caspian Sea and oil and gas fields under the exploitation in the Caspian Sea.
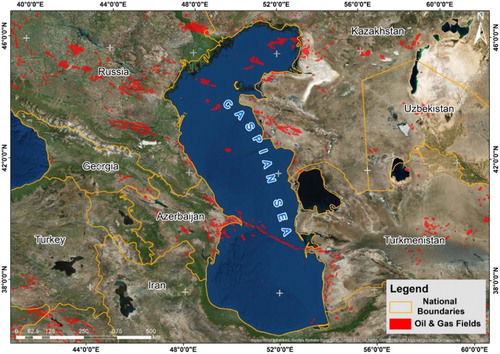
Figure 2. (a) Visible and (b) invisible oil slick because of wind speed; (c) radar backscattering of oil slicks and (d) backscattering of entire radar image (SENTINEL-1).
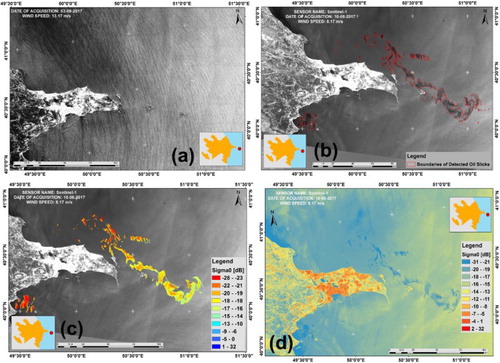
Figure 3. Coverage of radar and optical satellite images in the Caspian Sea.
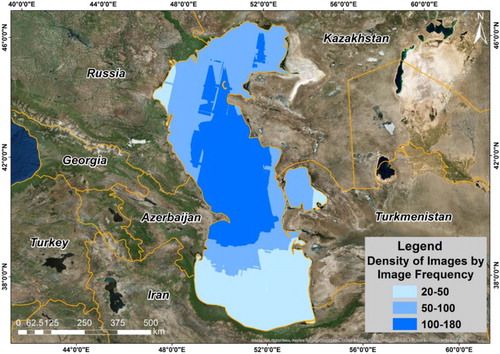
Table 1. Characteristics of satellite sensors and count of used satellite images.
Figure 4. Data-processing workflow for oil pollution studies in the Caspian Sea.
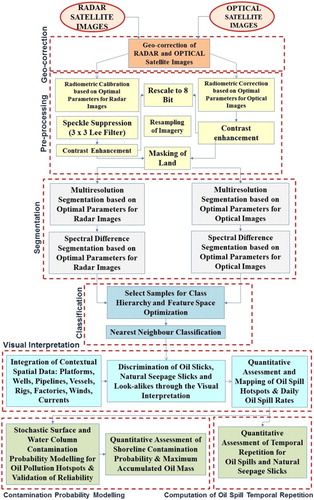
Table 2. Multiresolution and spectral difference segmentation parameters.
Table 3. Bonn agreement oil appearance codes (Bonn Agreement Aerial Operations Handbook Citation2009).
Figure 5. Overall distribution of oil spills and natural seepage slicks in the Caspian Sea.
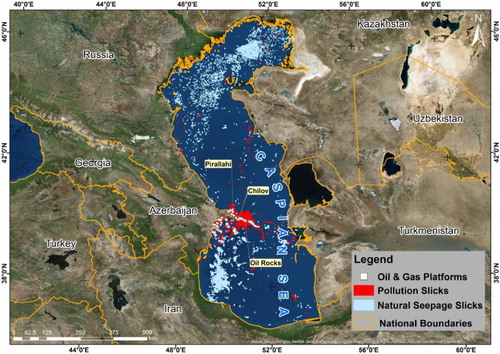
Figure 6. Temporal repetition (frequency) of oil spills and natural seepage slicks in the Caspian Sea.
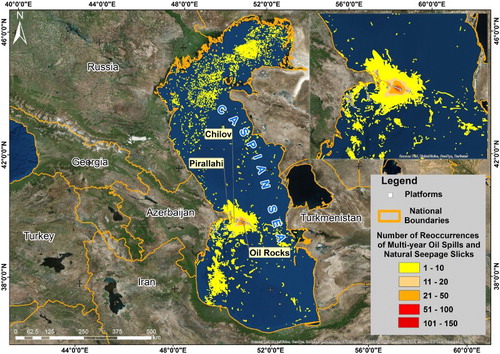
Figure 7. Heatmap of oil spills and natural seepage slicks in the Caspian Sea.
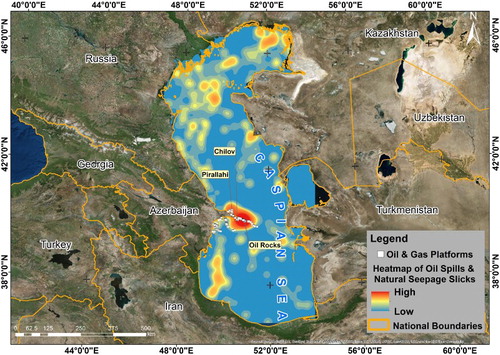
Figure 8. (a) Aerial view of the Oil Rocks Settlement; (b) Pirallahi and Chilov Islands; (c) repetition of oil spills associated with wells of Oil Rocks Settlement, Pirallahi and Chilov Islands and (d) sample aerial view of Bonn agreement oil appearance thickness codes (Bonn Agreement Citation2011).
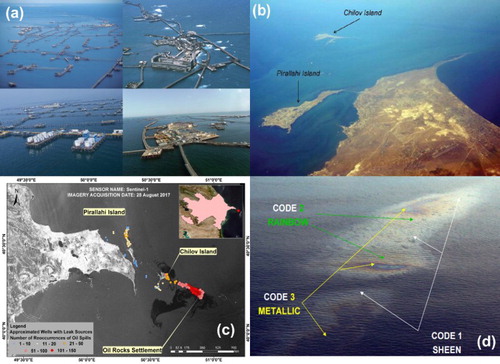
Figure 9. (a) Water surface: probability of contamination (%); (b) water column: probability of contamination (%); (c) total contamination probability risk (%) and (d) graph of water surface, water column and total contamination probability.
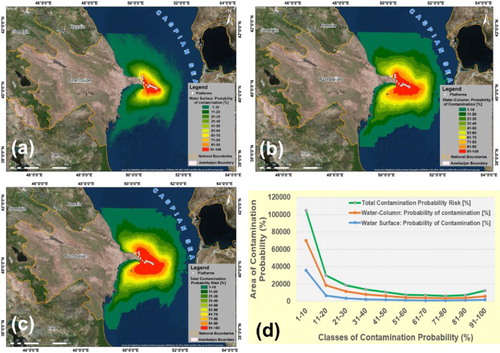
Figure 10. (a) Caspian Sea bathymetry and general circulation of currents; (b) detailed snapshots of Caspian Sea Winds; (c) currents visualised in OSCAR for date and time of 2007-05-07 06:00 and (d) currents around the Oil Rocks Settlement, Chilov and Pirallahi Islands.
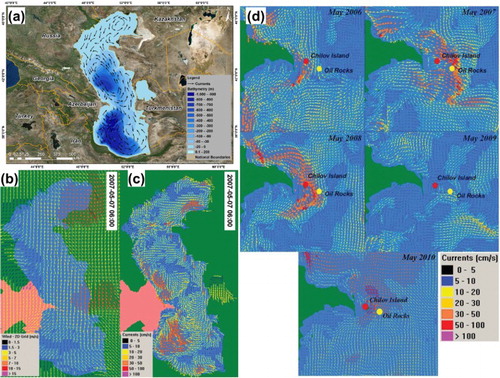
Figure 11. (a) Cross-validation of predicted contamination probability with overall boundary of detected oil spills in the Caspian Sea; (b) distribution of predicted contamination probability classes within overall boundary of detected oil spills from satellite images and (c) exponential regression between probability of oil contamination and temporal repetition of detected oil spills from satellite images.
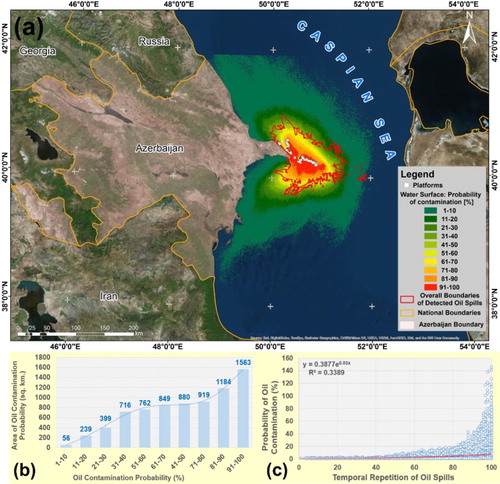
Figure 12. (a) Land-use classes along the shoreline of the Caspian Sea in Azerbaijan; (b) shoreline contamination probability (%) and (c) maximum accumulated emulsion mass (tonnes).
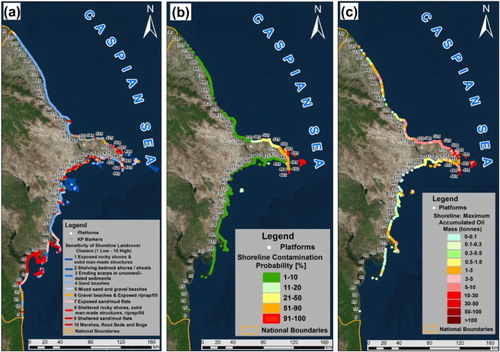
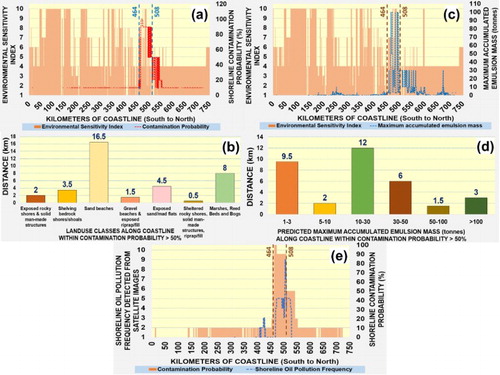
Figure 13. (a) Kilometre range of environmental sensitivities and contamination probability; (b) distance of land-use classes within contamination probability >50%; (c) kilometre range of maximum accumulated emulsion mass (tonnes); (d) distance of predicted maximum accumulated emulsion mass within contamination probability > 50%; (e) validation of shoreline contamination probability with shoreline pollution frequency detected from satellite images.