Figures & data
Figure 1. Scatter plots of scatterometer and HF radar wind directions. The colour coding is scatterometer wind speed in m/s.
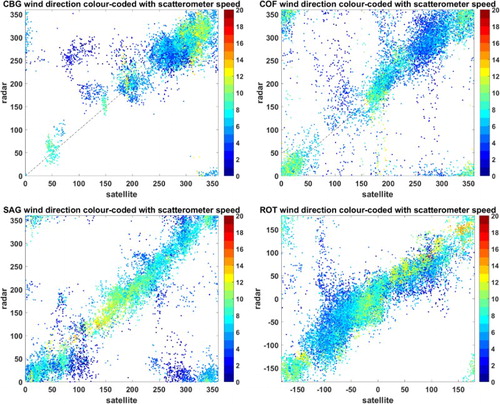
Figure 2. Histograms of scatterometer and HF radar wind directions. The colour coding is percentage of observations in each bin where the maximum on the scale is set at
the maximum percentage in any bin. For clarity bins with
of the maximum are not shown.
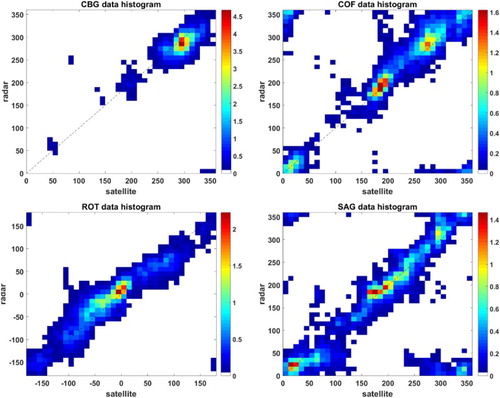
Table 1. Statistics of the comparisons.
Figure 3. Maps showing HF radar wind direction (black arrows) and directional spreading (colour-coded) with scatterometer winds (red arrows). The map for ROT (c) includes data from both Metop-A and -B. HF radar sites are labelled and marked with . Blue lines are depth contours.
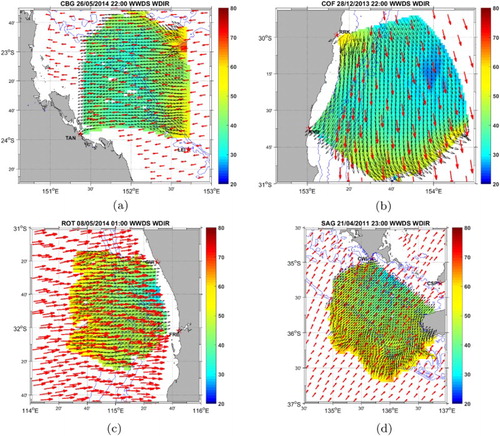
Figure 4. Maps showing HF radar wind direction (black arrows) and directional spreading (colour-coded) with scatterometer winds (red arrows). The map for ROT (c) includes data from both Metop-A and -B. HF radar sites are labelled and marked with . Blue lines are depth contours.
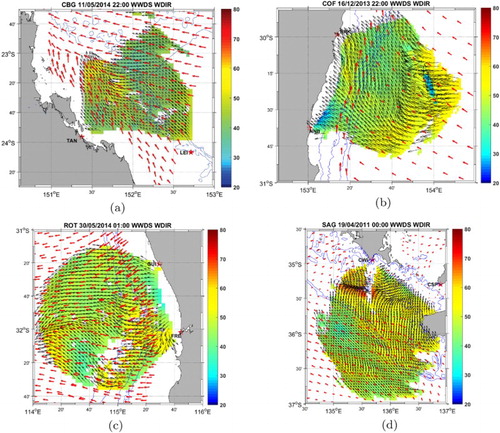
Figure 5. (a–i) Hourly (16:00 UTC 06/12/2013 to 00:00 07/12/2013) maps showing HF radar wind direction (black arrows) and directional spreading (colour-coded) with scatterometer winds (red arrows) during the movement of a high from west to east north of the site in central east Australia. Radar sites are labelled and marked with . Blue lines are depth contours. (j–l) Surface pressure charts at 12:00, 18:00 and 00:00.
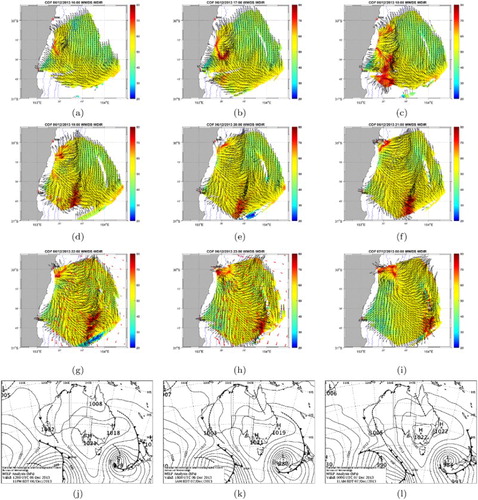
Figure 6. (a–c) Six-hourly maps (12:00 UTC 26/04/2014 to 00:00 27/04/2014) showing HF radar wind direction (black arrows) and directional spreading (colour-coded) before, during and after the passage of a low pressure system moving from north-west to south-east across SW Australia. Radar sites are labelled and marked with . Blue lines are depth contours. (d–f) Surface pressure charts at the corresponding times.
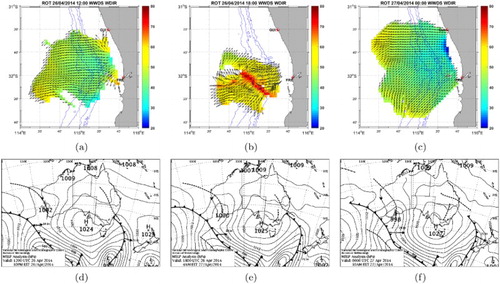
Figure 7. (a–f) Hourly maps (08:00 UTC to 13:00 08/04/2011) showing HF radar wind direction (black arrows) and directional spreading (colour-coded) with scatterometer winds (red arrows) before, during and after the passage of a cold front associated with a low pressure system moving from west to east with high pressure to the east across central South Australia. Radar sites are labelled and marked with . Blue lines are depth contours. (g–h) Surface pressure charts at 06:00 and 12:00.
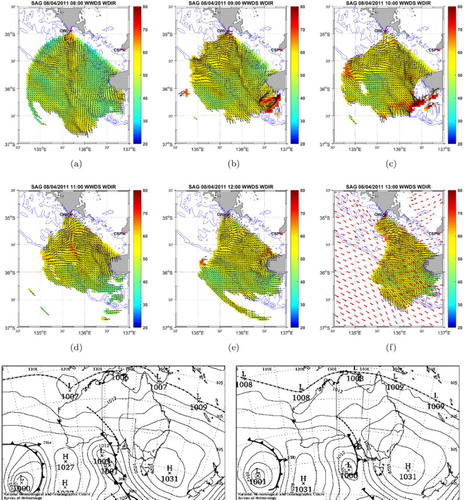
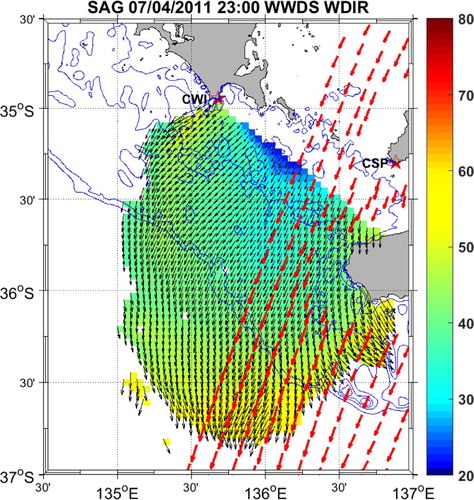
Figure 8. Map showing HF radar wind direction (black arrows) and directional spreading (colour-coded) with scatterometer winds (red arrows) for a fetch-limited case at SAG. HF radar sites are labelled and marked with . Blue lines are depth contours.