Figures & data
Figure 1. Location of studied upwelling areas.
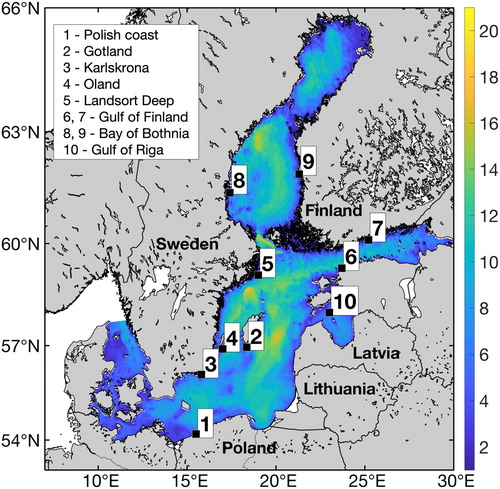
Figure 2. Sample upwelling detection scene. 13.09.2011 (a), 22.07.2013 (b), 18.08.2015 (c). Left – model, right – satellite. Upper – SST, lower – upwelling presence.
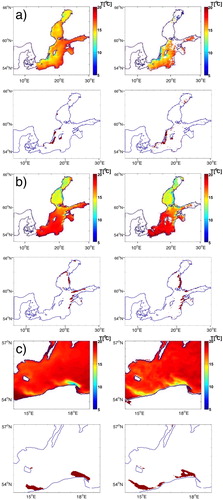
Figure 3. SST and wind time series of cases study from September 2011 (a) and July 2013 (b). Upper part represents wind time series. Lower part shows surface temperature. Red dots – model, green dots – satellite. On the lower bar: green – upwelling, red – no upwelling, ‘x’ – no data.
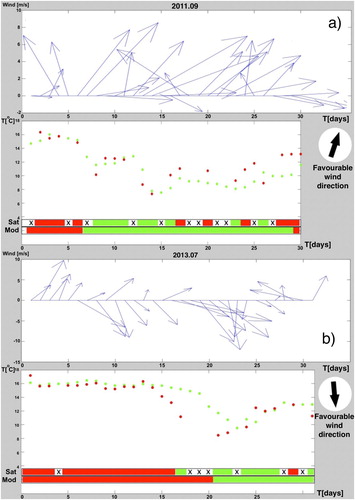
Figure 4. Mean upwelling frequency distribution between May and September for 2010–2016. Left – model, right – satellite.
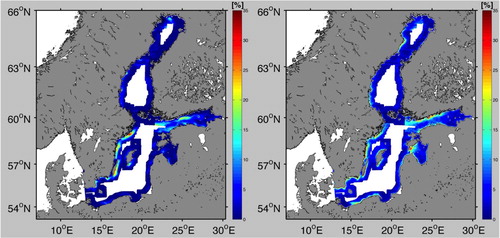
Table 1. Percentage of upwelling and favourable wind days.
Table 2. Statistics of upwelling detection tool.
Figure 5. Upwelling frequency distribution for years 2010–2016 (a–g). Left – model, right – satellite.
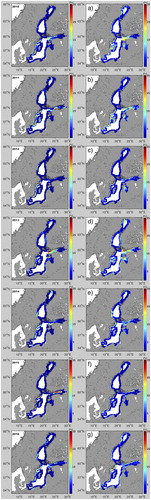
Figure 6. Monthly mean upwelling frequency distribution for May – September (a–e). Left – model, right – satellite.
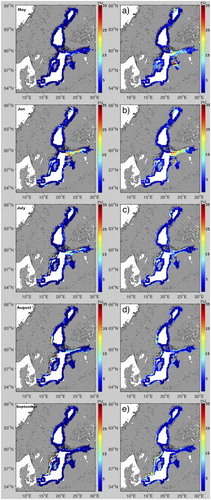
Figure 7. Upwelling Detection System website with an important navigation sections selected.
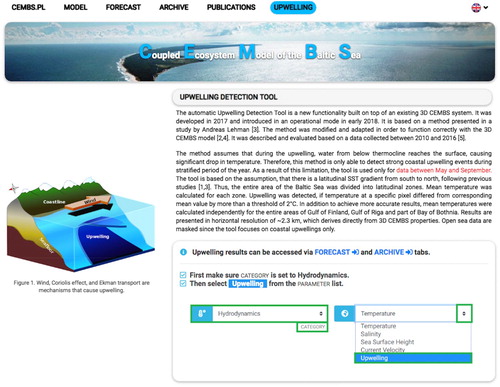
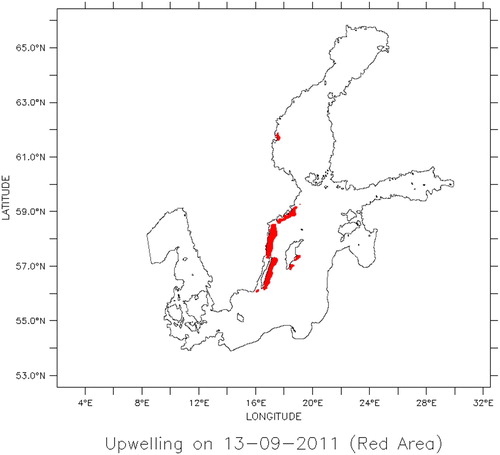
Figure 8. Sample map of places with an occurrence of upwelling on 18th August 2015 produced by the Upwelling Detection System.